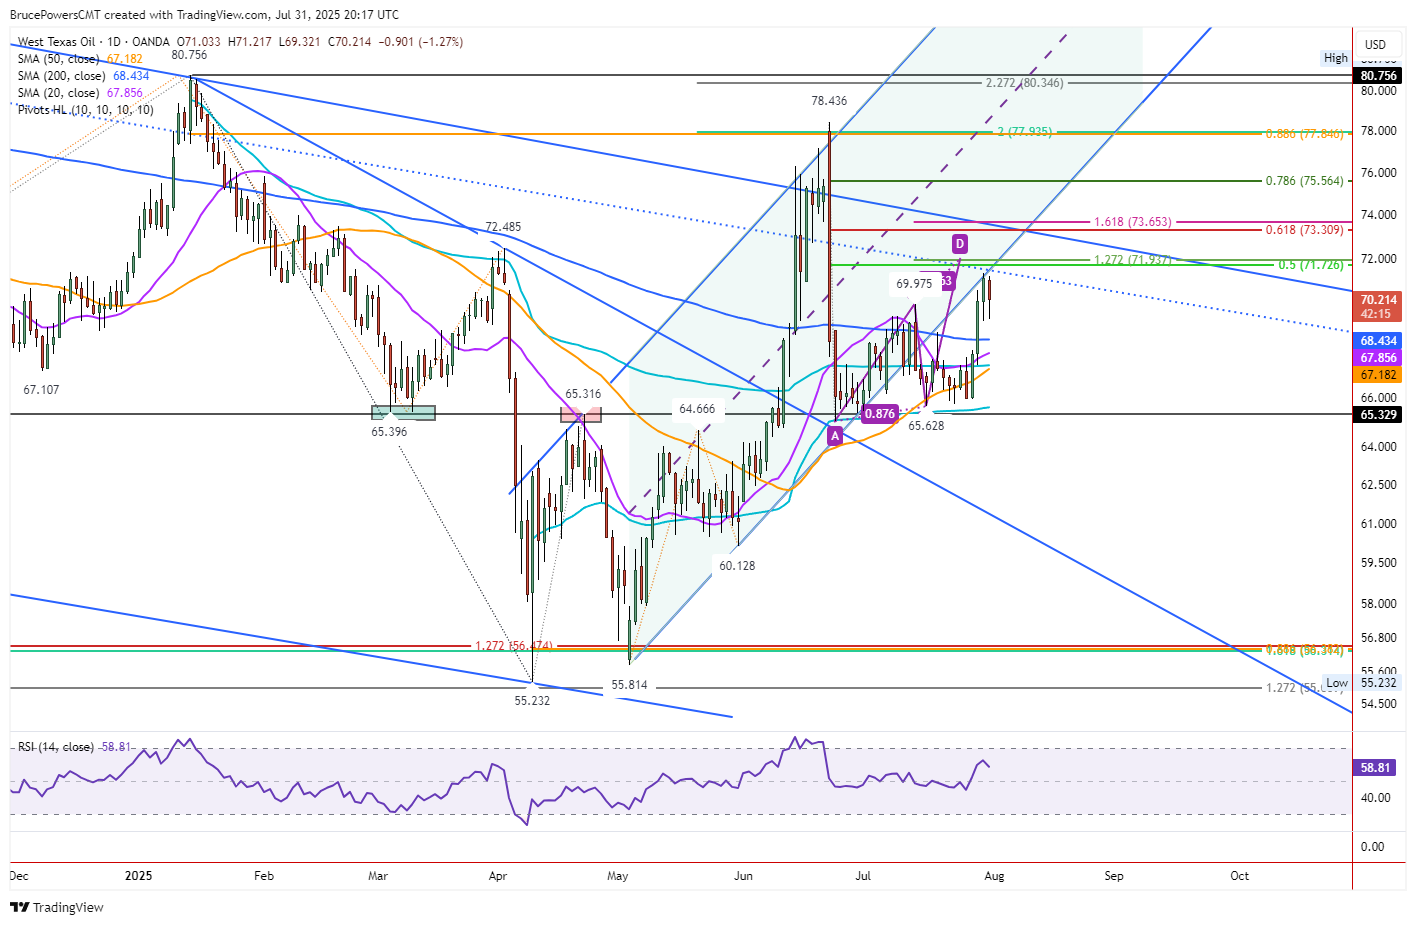
Crude oil consolidated within the prior day’s range on Thursday and with a loss for the day. It again tested a resistance zone with the day’s high of $71.22. A lower rising trend channel line has been tested successfully as resistance for the past few days, and it follows a breakdown from the channel earlier in July.
Given its current trajectory, crude oil might reach its next upside target around a 50% retracement level at $71.73, while continuing to test resistance around the trendline. The 50% zone is joined by a 127.2% projected target for a rising ABCD pattern at $71.94.

Five-Week High Breakout
Earlier in the week crude oil triggered a bull breakout to a five-week high of $71.33. It is on track to end the week in a relatively bullish position, in the upper third of the week’s trading range. If it can close the week above $69.98, the bullish breakout on the weekly timeframe will be confirmed. That would potentially increase the possibility of a continuation to the upside, at least to the next target zone mentioned above.
If the advance can continue, as the weekly chart supports, the 61.8% Fibonacci retracement zone at $73.31 is the next upside target. A downtrend line crosses through that Fibonacci level by August 11. After that a downtrend line will represent potential dynamic resistance prior to the 61.8% level.
Support at 200-Day Moving Average
Given that there have been signs of short-term resistance over the past couple of days, a pullback might follow. Potential support around the 200-Day MA is a key area to watch for a bounce and bullish reversal. However, if selling persists there is a consolidation zone of potential support down to the recent low at $65.63. That should slow down bearish momentum if it persists. This week’s low of $65.90 is also a potential support area of note, as well as last week’s high of $67.68.
Upside Potential Remains
It is important to keep in mind that crude oil remains in a five-day consolidation zone until it confirms the weekly breakout. A rise from the bottom of a large descending channel at the April swing low pointed to a potential test of resistance at the top of the channel. That happened in June. Now that crude is again rising from key support levels, the top of the channel becomes a potential target. Keep this in mind if crude oil gets closer to the top channel line.
WTI Crude Oil Price Forecast
Every new WTI Crude Oil analysis as it publishes, today's technical signal and key levels, live price — on one page.
See all WTI Crude Oil forecastsFor a look at all of today’s economic events, check out our economic calendar.