


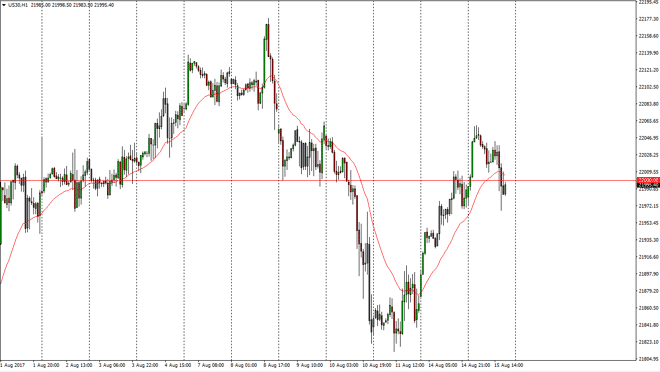
Dow Jones 30
The Dow Jones 30 initially shot much higher during the day on Tuesday, slicing through the 22,000 level. However, we turned around at the 22,050 level, and broke below 22,000 again. If we can break above 22,000, and hold it on the daily close, I think that the market probably goes higher. Otherwise, we may need to pull back to build up enough momentum to continue the uptrend below. There is a lot of undercurrent in the marketplace that is swirling in both directions, so I do anticipate quite a bit of volatility.
Dow Jones 30 and NASDAQ Index Video 16.8.17
NASDAQ 100
The NASDAQ 100 has pulled back to the 5900 level after initially looking very strong at the open on Tuesday. If we can continue to hold above the 5900 level, I think that’s a very bullish sign. However, if we break down below the 5880 handle, I think that it’s probably best to stand on the sidelines and wait for support underneath to take advantage of. Although one could make the argument for being overbought, I don’t have any interest in shorting this market.
