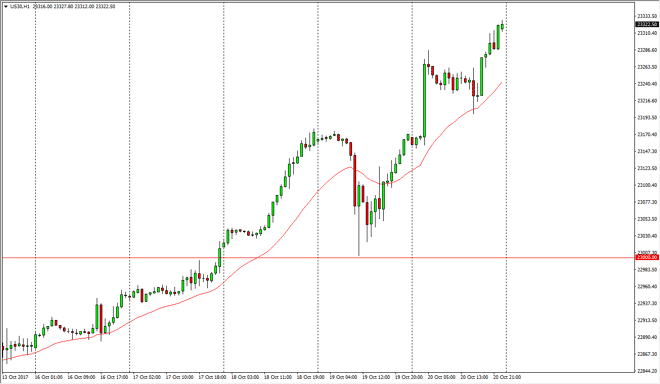
Dow Jones 30 The Dow Jones 30 significantly rally during the day on Friday, reaching to fresh, new highs. The market continues to be bullish overall, and
The Dow Jones 30 significantly rally during the day on Friday, reaching to fresh, new highs. The market continues to be bullish overall, and this explosive move has gotten a bit overextended. Because of this, looking for buying opportunities at lower levels as it gives an opportunity to pick up value. I don’t have any interest in shorting though, even though I think that we are going to drop down from here. The 23,000-level underneath is going to be massive support, so it’s not until we break down below there that I would become remotely concerned. Beyond that, I think that the market could go to the 24,000-level next, with a stop at the 23,500 level between here and there. It will be volatile, but quite frankly I think that buying is the only thing that you can do.
The NASDAQ 100 broke to the upside during the day on Friday, reaching towards the 6125 handle. We pull back from there, and it looks as if the support has come back into the market near the 6100 level. When you look at the longer-term charts, there’s an ascending triangle that we broke out of once we sliced through the 6000 handle, and now I think that we are going to fulfill the extension of that consolidation area, which has this market looking towards the 6200 level. That’s not to say that we can’t pull back from here, but I think the given enough time we will find buyers. The NASDAQ 100 might have a little bit of catching up to do compared to the other indices, but overall US indices are very bullish, and therefore I think that they will all rise over the longer term.
Chris is a proprietary trader with more than 20 years of experience across various markets, including currencies, indices and commodities. As a senior analyst at FXEmpire since the website’s early days, he offers readers advanced market perspectives to navigate today’s financial landscape with confidence.