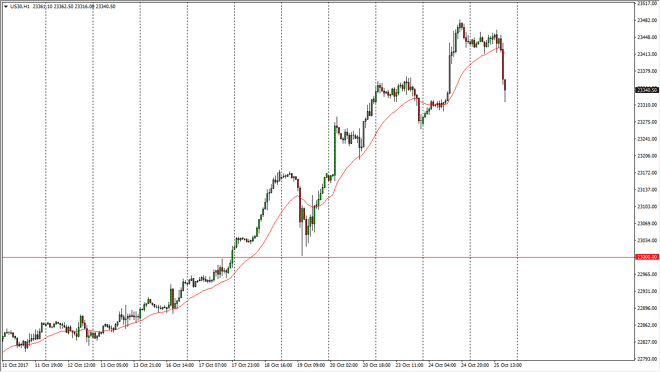
Dow Jones 30 The Dow Jones 30 rolled over rather drastically as US stock traders sold everything in sight. Quite frankly, this is a market that has been
The Dow Jones 30 rolled over rather drastically as US stock traders sold everything in sight. Quite frankly, this is a market that has been overextended for some time, and thinking that we could continue the trajectory that we had seen over the last several weeks was a bit foolhardy. However, if you are patient enough you should see value in the market return, and I think that we could fall as low as 23,000 and still retain a very bullish attitude. Remember, the markets climb a wall of worry while falling like a knife. This is essentially what we’re seeing, hot and nervous money flowing out of the market. We are still very much in an uptrend, so I’m waiting for a sense of stability to return to the market, so I can take advantage of the new value, and start buying again.
The NASDAQ 100, of course, fell as well, slicing through the 6050 handle. This is a significant development, and what this tells me is that we may have a little bit of follow-through to the downside. However, I have absolutely no interest in trying to short this market, as I recognize the 6000-level underneath being massively supportive as it was massively resistive. Looking for some type of stability or supportive candle is what I am doing now, and I think I will get it over the next couple of days. Let the panic subside, and then pick up the cheap NASDAQ 100 is how I look at this market. If we were to break down significantly below 6000, that changes everything else, but right now I don’t think that’s going to happen as this move has been rather sudden, and typically those moves fade.
Chris is a proprietary trader with more than 20 years of experience across various markets, including currencies, indices and commodities. As a senior analyst at FXEmpire since the website’s early days, he offers readers advanced market perspectives to navigate today’s financial landscape with confidence.