Dow Jones 30 The Dow Jones 30 went sideways during most of the session on Tuesday, but started to see buyers jump into the market later in the day. This
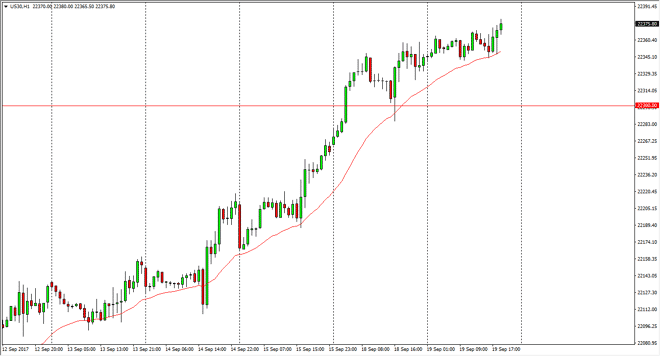
The Dow Jones 30 went sideways during most of the session on Tuesday, but started to see buyers jump into the market later in the day. This is a continuation of the uptrend that we have seen for some time, and I believe that we continue to find support below at the 22,300 level. Ultimately, the market should then go to the 22,500 level above. Pullbacks offer value, and I believe that with the Federal Reserve meeting today and having a statement come out, it’s likely that we will see dovish statements coming from the Fed, giving us an opportunity to have cheap money going forward. Ultimately, that should send stocks higher as the bond returns simply won’t be there to be had. I like buying dips in this market, and I believe that we are going to go looking for the aforementioned 22,500 level.
The NASDAQ 100 was choppy and did try to break out to the upside that ran into a bit of trouble at the 6000 handle. Ultimately, I do think that we break above there but we obviously have a significant amount of resistance. A clearance of the 6020 level would be a sign that the buyers are going to continue to reach higher, and given this, I believe that pullbacks will continue to be buying opportunities. As far selling is concerned, I believe that we need to see the overall stock market selloff before I would short this market. Ultimately, I believe that the 5950 level underneath continues to be massively supportive, and as all US indices tend to move in the same direction, I think it’s only a matter of time before we go higher. However, I much prefer the S&P 500 and the Dow Jones 30 currently.
Chris is a proprietary trader with more than 20 years of experience across various markets, including currencies, indices and commodities. As a senior analyst at FXEmpire since the website’s early days, he offers readers advanced market perspectives to navigate today’s financial landscape with confidence.