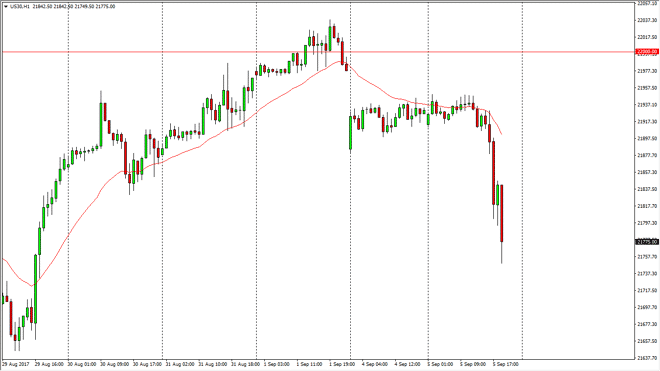
Dow Jones 30 The Dow Jones 30 initially went sideways on Tuesday, but then fell from a cliff and broke down. Ultimately, I think that the market should
The Dow Jones 30 initially went sideways on Tuesday, but then fell from a cliff and broke down. Ultimately, I think that the market should continue to find sellers only because we have recently been a bit over heated, and we could continue to see rallies offer selling opportunities. I don’t think that the uptrend is over, I just think that the long-awaited correction has shown itself. I would not be a buyer in this market until we get a daily candle that is very supportive. In the meantime, I think short-term sellers will return to this market repeatedly, as it looks like the sharks smell blood in the water.
The NASDAQ 100 also went sideways initially during the day but started to fall right away as Americans came back to work. The 5900 level is currently looking supportive, but if we break down below there, then the market should go looking to lower levels for support. The NASDAQ 100 has been the leader of other indices for some time, so pay attention to this chart, even if you are not trading this particular market. It will tell you where the other ones are getting ready to go. I believe that we are starting to see a correction here as well.
Chris is a proprietary trader with more than 20 years of experience across various markets, including currencies, indices and commodities. As a senior analyst at FXEmpire since the website’s early days, he offers readers advanced market perspectives to navigate today’s financial landscape with confidence.