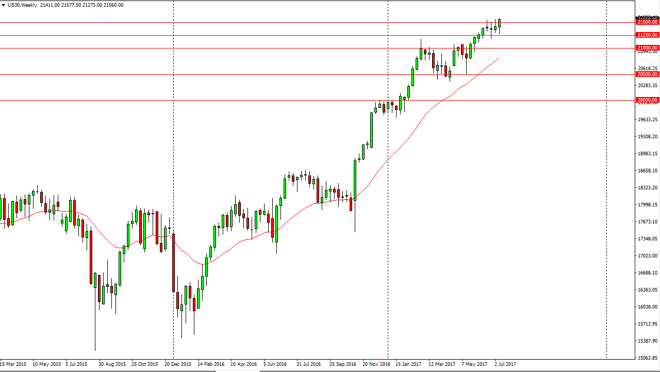
Dow Jones 30 The Dow Jones 30 initially fell during the week but found enough support near the 21,250 level to turn things around and break above the
The Dow Jones 30 initially fell during the week but found enough support near the 21,250 level to turn things around and break above the 21,500 level. Now that we have broken above there, I believe that the Dow Jones 30 is ready to go higher, and therefore short-term pullbacks are probably going to be buying opportunities. Buy-and-hold traders are most certainly going to be involved as well, and I now think that the Dow Jones 30 will go looking towards the 21,750-level next, with an eye on the 22,000 level. I have no interest in shorting this market, I believe that the buyers are very much in control.
The NASDAQ 100 broke the top of a weekly hammer from the previous week, slicing through the 5700 level, and then eventually the 5800 level. Because of this, the market should continue to go higher, perhaps reaching towards the 5900 level. A break above there sends this market looking for the 6000 handle longer term. That’s my target anyway, and I like the look at this chart so therefore I am a buyer of dips and the NASDAQ 100 expecting the buyers to continue to push this market to the upside. Ultimately, this is a market that’s in a strong uptrend, and the chart looks as if it is trying to form some type of bullish flag, and that could send the markets to even higher levels than I am predicting currently. I have no interest in shorting this market, I believe that the buyers are very much in control as the NASDAQ 100 has been the leader of US stock indices over the last several months, and essentially since the beginning of the year.
Chris is a proprietary trader with more than 20 years of experience across various markets, including currencies, indices and commodities. As a senior analyst at FXEmpire since the website’s early days, he offers readers advanced market perspectives to navigate today’s financial landscape with confidence.