


Saudi Strikes on Energy Dropped the Dow 641 Points
The Dow Jones Industrial Average fell 641 points Tuesday after Houthi militants attacked Saudi energy facilities and Brent crude tagged $99.46. WTI extended its winning streak to six sessions.
Treasury yields held near multi-month highs with the Producer Price Index Thursday and Consumer Price Index Friday as the last inflation data before the September 15-16 Fed meeting. The S&P 500 lost 0.4%. The Nasdaq Composite slipped 0.4%.
Qualcomm jumped more than 7% on a data-center partnership with Amazon Web Services and kept the chip group bid while the rest of the tape sold.
Daily Dow Jones Industrials Technical Analysis
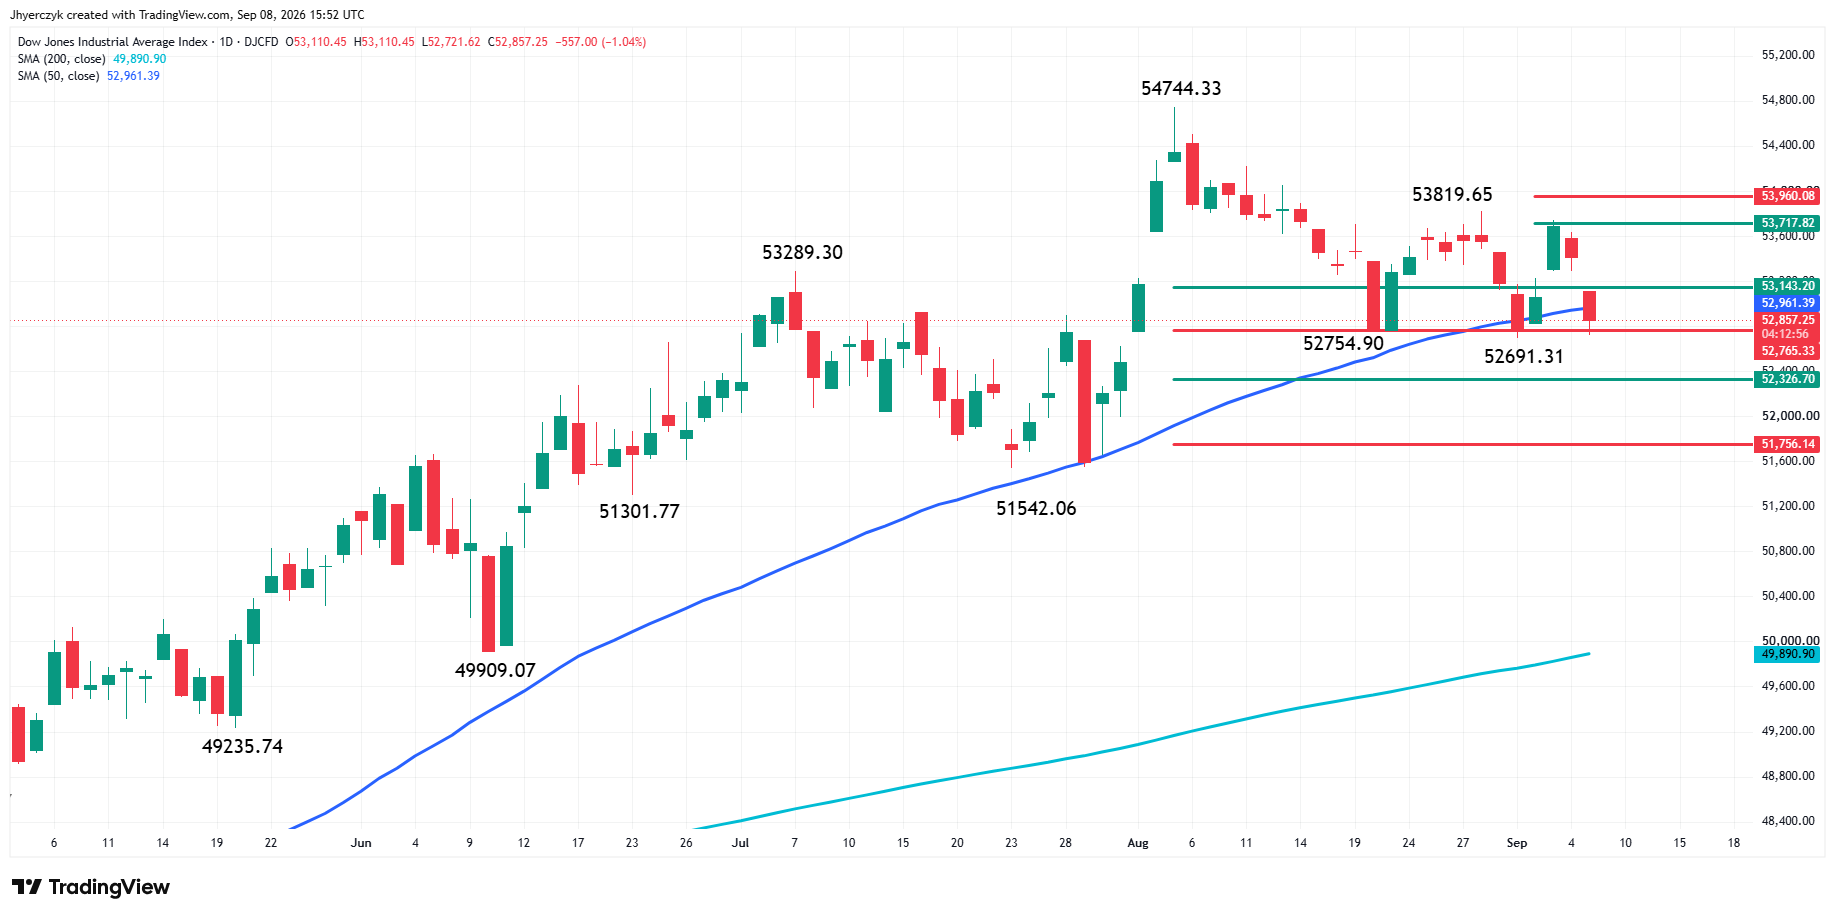
The Dow Jones is under pressure on Tuesday after crossing to the weak side of the 50-day moving average at 52,961.39. The Dow is also trading inside a retracement zone at 53,143.20 to 52,765.33. Trader reaction to this zone is likely to control the direction today.
Buyers came in Tuesday at 52,721.62 to defend the swing bottom at 52,691.31. If this level fails, the market could plunge into the intermediate retracement zone at 52,326.70 to 51,756.14.
Regaining the 50-day moving average will put the Dow in a position to challenge 53,143.20. Overcoming this retracement level could create the upside momentum needed to retest the short-term resistance zone at 53,717.82 to 53,960.08. Inside this zone is the last swing top at 53,819.65.
Houthi Attacks Hit Saudi Energy Facilities
Iran-allied Houthi militants attacked energy facilities in Saudi Arabia on Tuesday. Fires broke out. Some sites shut down temporarily. Saudi authorities did not identify which facilities were hit. More than 70 civilians were injured in strikes across several Saudi cities.
Dow Jones Price Forecast
Every new Dow Jones analysis as it publishes, today's technical signal and key levels, live price — on one page.
See all Dow Jones forecastsThe attacks came after weekend exchanges between U.S. and Iranian oil tankers. Oil traffic through the Strait of Hormuz is still running well below normal.
Brent settled at $98.13 after running to $99.46 on the session. WTI picked up 1.95% to $93.26.
Energy Stocks Confirmed the Move With Record Highs
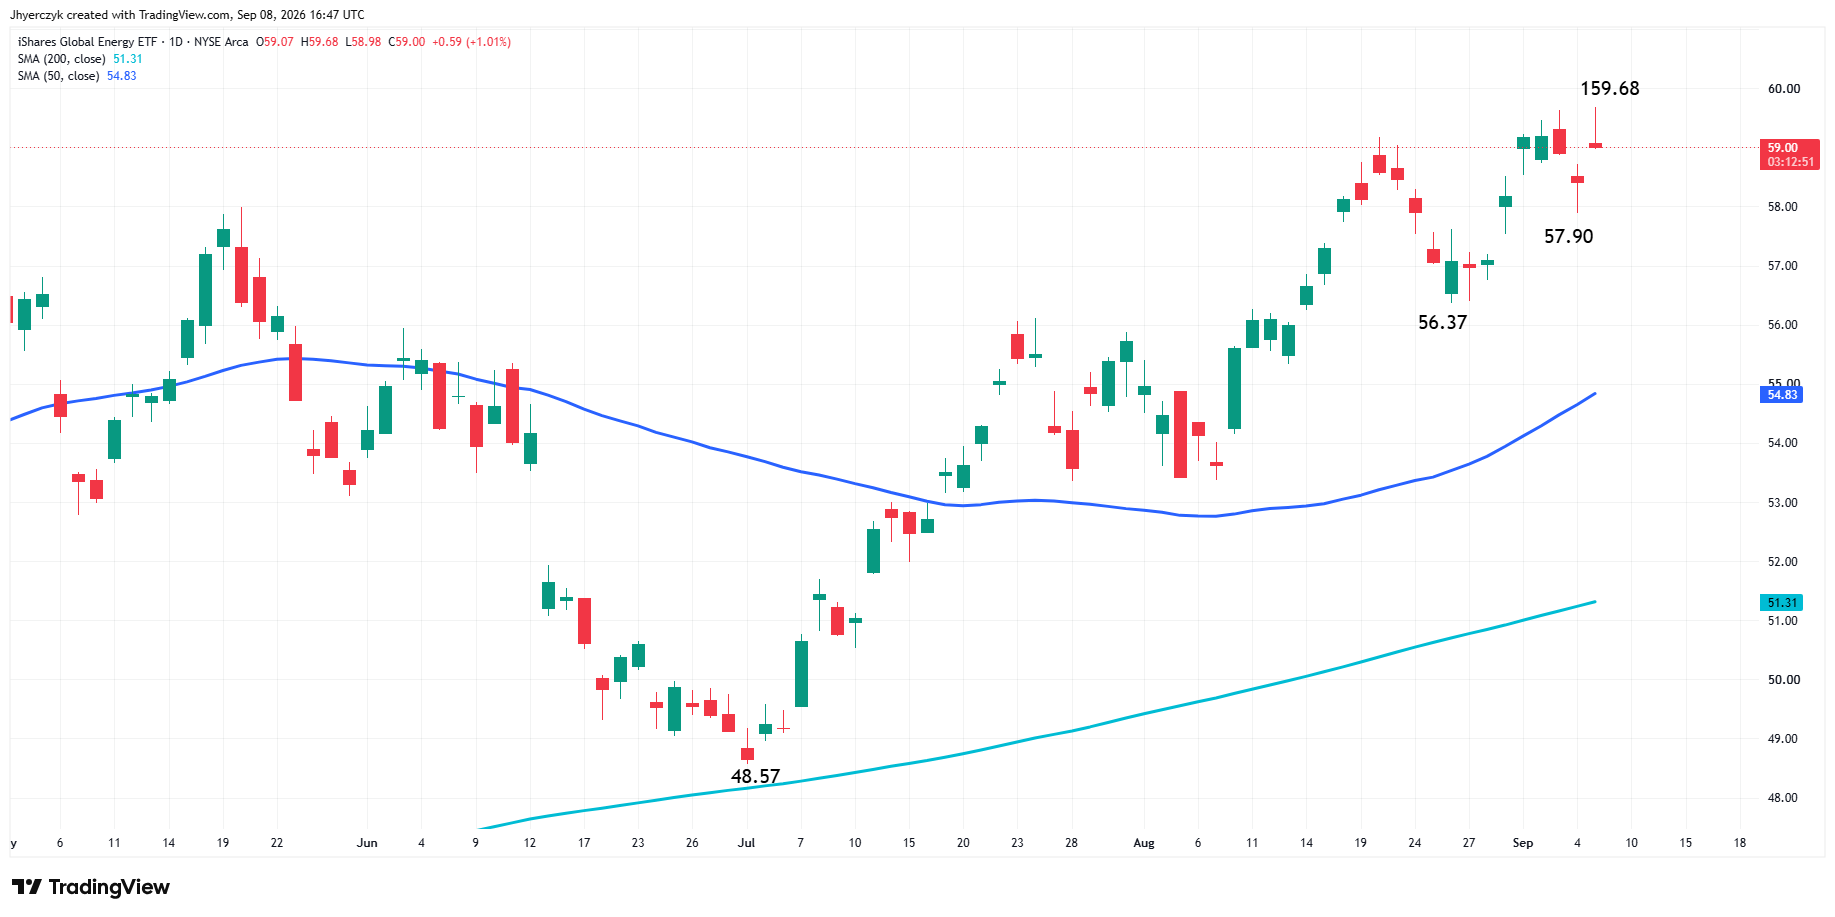
The iShares Global Energy ETF reached a record high, rising 1.8%. The SPDR S&P Oil & Gas Exploration & Production ETF gained 2.3% and hit its highest level since June 2015. Petrobras rose more than 4%. PetroChina and APA each advanced more than 3%.
The E&P ETF just printed a level it has not seen in over a decade. Tuesday’s Saudi strikes landed on a sector that was already running and the buyers did not slow down.
Yields Near Multi-Month Highs With Inflation Data This Week
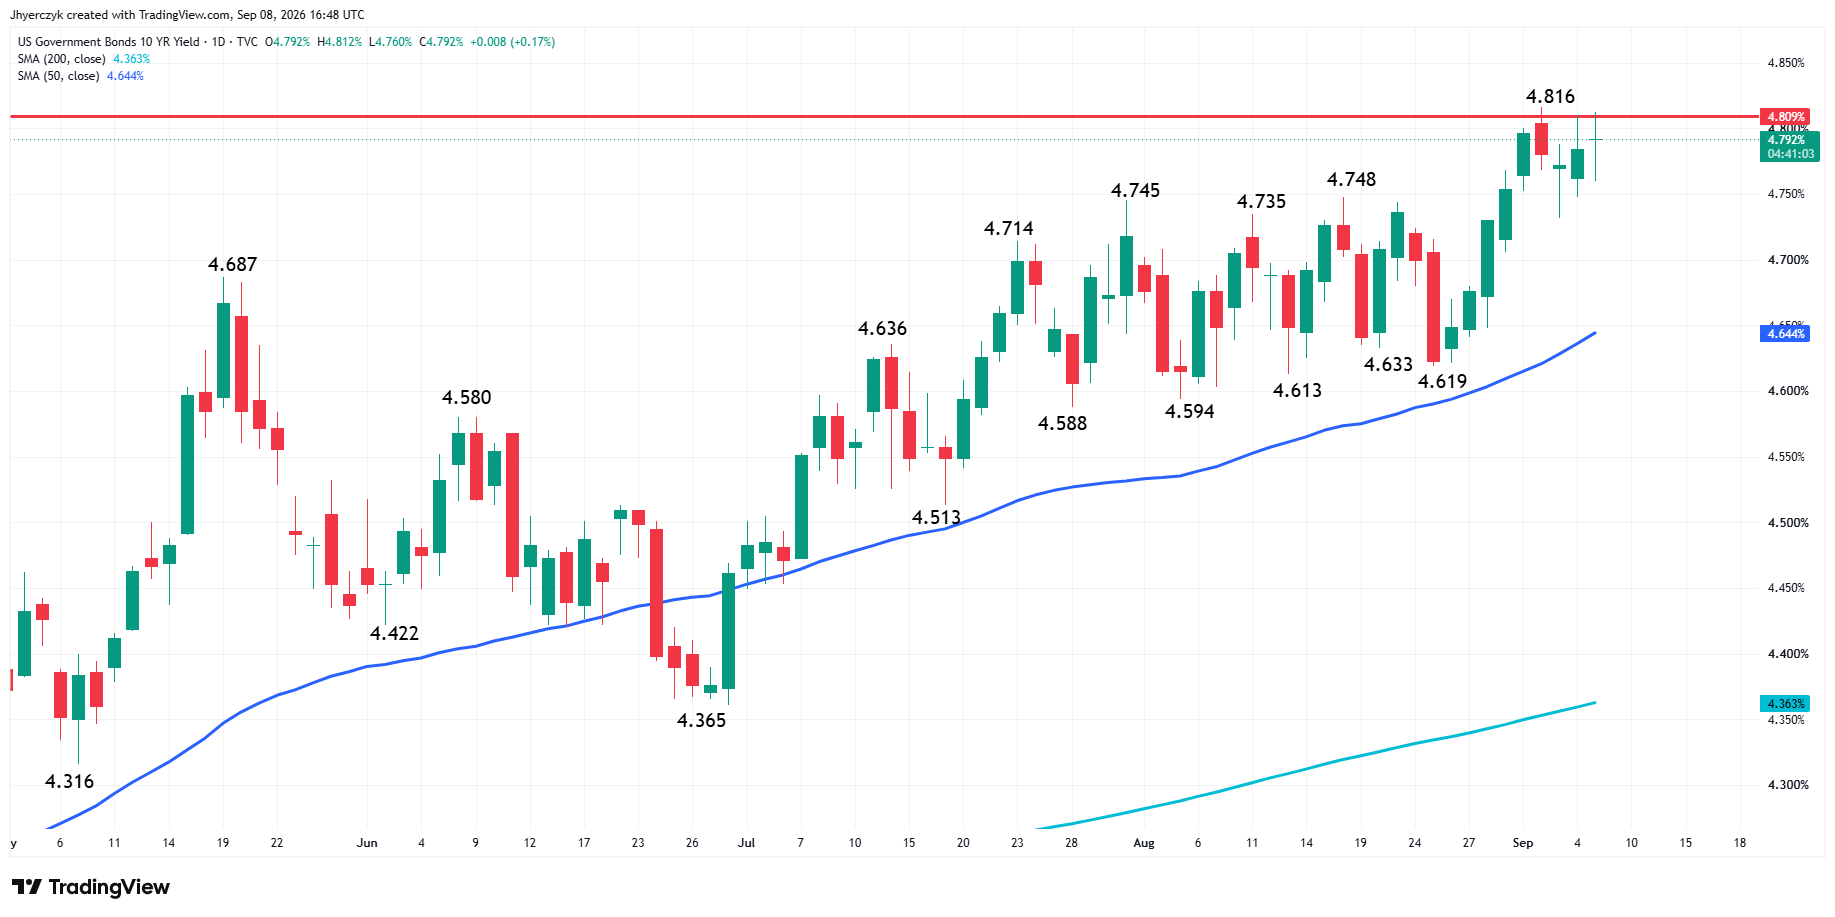
The 10-year Treasury yield reached its highest level since November 2023 last week. The 2-year hit its highest since January 2025. Traders have pushed September rate-hike odds to 60%.
PPI lands Thursday. CPI lands Friday. Those are the last major inflation reports before the September 15-16 meeting.
Qualcomm’s AWS Deal Carried the Chip Group
Qualcomm ran more than 7% Tuesday after landing a multigenerational deal with AWS to design customized silicon for Amazon’s AI infrastructure.
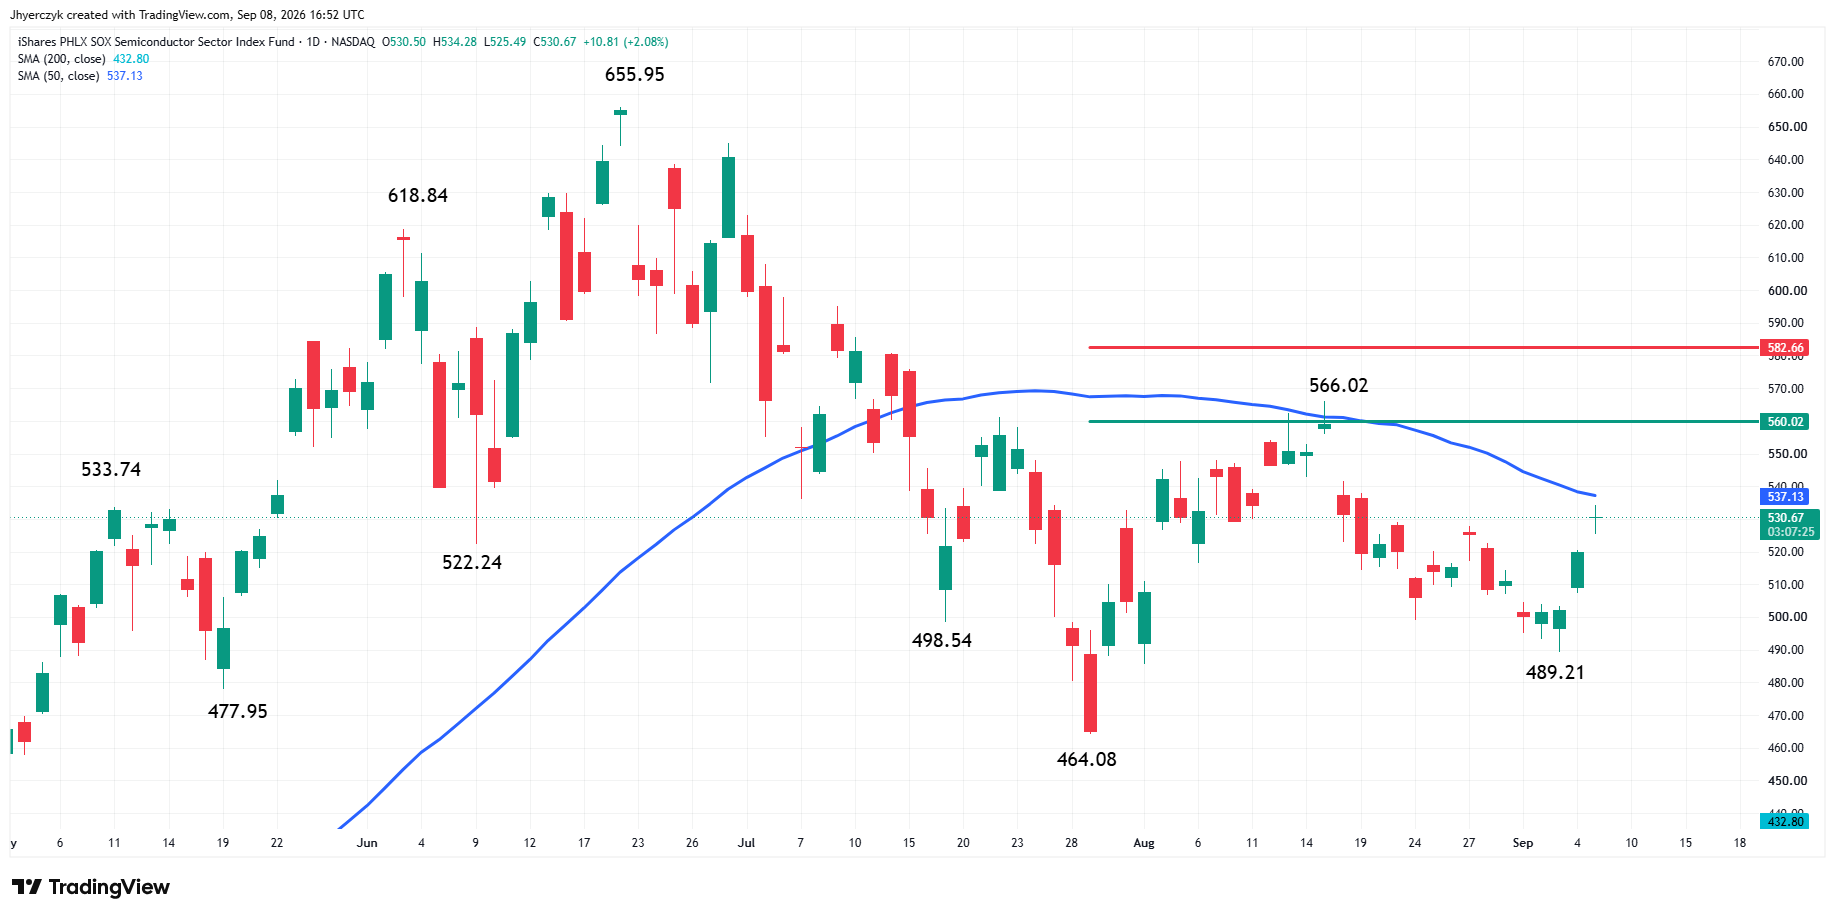
The semiconductor ETF added 1.7% with Intel up 4.7% leading the group. Broadcom picked up 1.1% and Nvidia edged up 0.7%. The strength ran across the sector on a session where the rest of the market was selling.
One deal does not change the competitive picture. Qualcomm has to hold the gain through the inflation prints this week.
Bloom Energy Got the S&P 500 Call
Bloom Energy advanced more than 6% Tuesday. The stock enters the S&P 500 before the September 21 open as part of the quarterly rebalance. Bloom is up about 190% this year on the AI data-center power trade.
Stocks in the News
Novartis fell on another late-stage drug trial failure. Boston Scientific slipped after warning a cyberattack could affect 2026 sales and profit targets. Peloton dropped on a Morgan Stanley downgrade.
What to Watch
Saudi energy facilities are now targets. Hormuz traffic is still depressed. Brent tagged $99.46 Tuesday and backed off but the next headline could put it through $100. PPI Thursday and CPI Friday land with WTI on a six-session winning streak and Brent one headline away from $100.
The near-term read is bearish while the Dow stays below the 50-day moving average at 52,961.39. Buyers defended 52,691.31 Tuesday. A failure of that level opens the intermediate retracement zone at 52,326.70 to 51,756.14. A sustained push back above the 50-day weakens the bearish case, but the swing top and resistance zone overhead make rallies from here a labored trade.
More Information in our Economic Calendar.