
Advertisement
Advertisement
E-mini Dow Jones Industrial Average (YM) Futures Analysis – August 21, 2015 Forecast
By:
September E-mini Dow Jones Industrial Average futures sold-off during the pre-market session, continuing yesterday’s steep break. The market is testing a
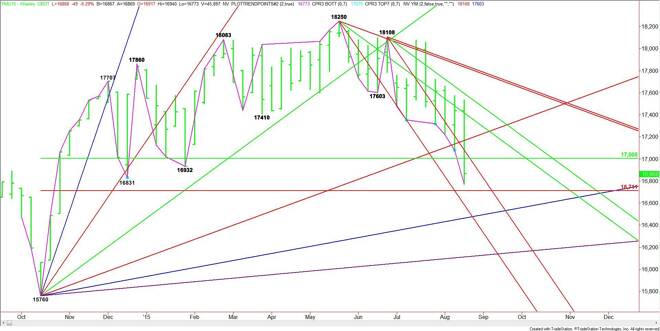
September E-mini Dow Jones Industrial Average futures sold-off during the pre-market session, continuing yesterday’s steep break. The market is testing a major retracement zone so short-sellers have to watch for value-seekers attempting to stop the slide and reverse the market to the upside.
The main trend is down on the daily and weekly swing charts. The main range is 15760 to 18250. Its retracement zone is 17005 to 16711. Yesterday, the Dow broke sharply when it took out the 50% level at 17005, however, the selling pressure subsided when the Dow approached the Fibonacci level at 16711.
According to the weekly chart, the first downside objective today is the Fib level at 16711. The next is the steep downtrending angle at 16586. The best downside target is an uptrending angle at 16464.
On the upside, the first target is the 50% level at 17005 and a steep downtrending angle at 17084. This level is a potential trigger point for an upside breakout.
The direction of the Dow over the near-term is likely to be determined by trader reaction to 17005 on the upside and 16711 on the downside.
About the Author
James Hyerczykauthor
James Hyerczyk is a U.S. based seasoned technical analyst and educator with over 40 years of experience in market analysis and trading, specializing in chart patterns and price movement. He is the author of two books on technical analysis and has a background in both futures and stock markets.


Advertisement