
Advertisement
Advertisement
E-mini Dow Jones Industrial Average (YM) Futures Analysis – October 9, 2014 Forecast
By:
Early in the session on Wednesday, December E-mini Dow Jones Industrial Average futures survived an attempt to take out the recent bottom at 16589 with
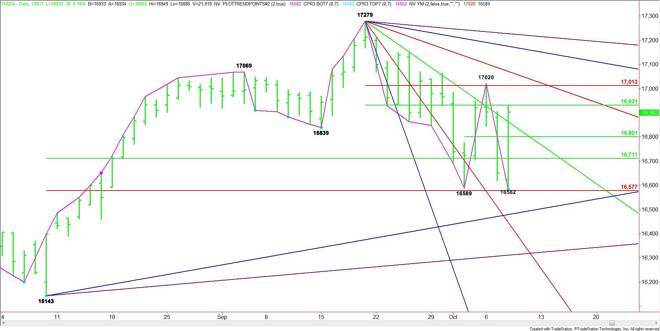
Early in the session on Wednesday, December E-mini Dow Jones Industrial Average futures survived an attempt to take out the recent bottom at 16589 with conviction. Although this level was violated by 7 points, buyers came in at 16582, slightly above the major Fibonacci level at 16577. The subsequent short-covering rally has put the Dow in a position to turn the main trend to up on the daily chart.
Today’s key support levels are widely staggered at 16801, 16711 and 16577. Because of the distance between them, traders can expect volatility if there is a sell-off. Breaking under 16577 could trigger further weakness into 16487.
The main range is 17279 to 16582. The retracement zone formed by this range is the primary upside target today. This zone is 16931 to 17013. The lower, or 50% level at 16931 stopped the rally yesterday. The main top and change in trend level at 17020 is slightly above the 17013 Fibonacci level.
A breakout then sustained move over 17020 could trigger a further rally into downtrending angles at 17055, 17167 and 17223. The final angle is the last resistance before the all-time high at 17279.
The key angle to watch is trending down from the 17279 top. It comes in at 16831 today. The market closed over this angle so in order to continue the rally through the retracement zone, it must stay on the bullish side of the angle.
Crossing back under 16831 will be the first sign of selling pressure. This is why trader reaction to this angle will set the tone for the day. The longer the Dow stays above this angle, the greater the chance it has at eventually breaking through the retracement zone at 16931 to 17013. And once it does, a strong rally should ensue.
About the Author
James Hyerczykauthor
James Hyerczyk is a U.S. based seasoned technical analyst and educator with over 40 years of experience in market analysis and trading, specializing in chart patterns and price movement. He is the author of two books on technical analysis and has a background in both futures and stock markets.


Advertisement