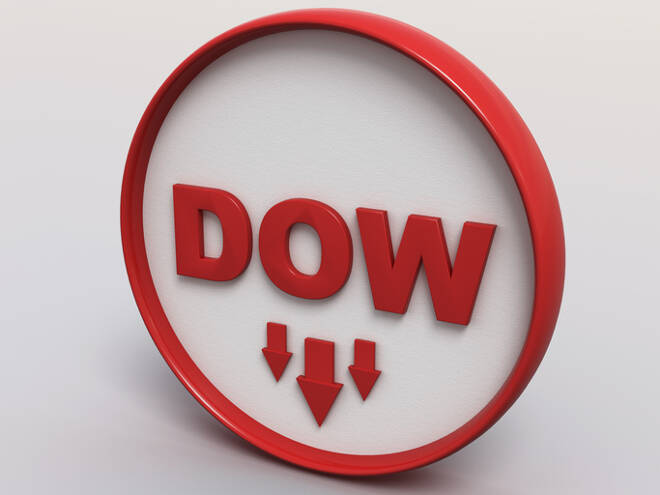
The Dow closed higher last week, but also settled lower three out of five trading sessions.
September E-mini Dow Jones Industrial Average futures finished lower on Friday after posting a volatile, two-sided trade throughout the session. Gains were capped by spiking cases of COVID-19 and Apple Inc’s announcement of fresh store closures. Prices were underpinned throughout the week on anticipated stimulus and continued economic recovery.
On Friday, September E-mini Dow Jones Industrial Average futures settled at 25529.
Apple Inc announced it is temporarily shutting some stores in Florida, Arizona, South Carolina and North Carolina, which have seen a spike in coronavirus cases in recent days.
The Dow posted a solid gain for the week and is now 8.5% shy of its all-time high reached in February.
In other news, in a video conference, U.S. Federal Reserve Chair Jerome Powell warned the economic recovery from the pandemic is set to be challenging and there will be no quick fix.
The main trend is up according to the daily swing chart, however, momentum is trending lower. The formation of a secondary lower top is weighing on momentum.
A trade through 27466 will signal a resumption of the uptrend, while a trade through 22640 will change the main trend to down.
The minor trend is down. A move through 26658 will change the minor trend to up. This will also shift momentum to the upside.
The minor range is 27466 to 24409. Its retracement zone at 25938 to 26298 is resistance. This zone had a hand in stopping the buying last week.
The short-term range is 22640 to 27466. Its retracement zone at 25053 to 24484 is support. This zone stopped the selling last week.
The Dow closed higher last week, but also settled lower three out of five trading sessions. Additionally, we are seeing early signs of a secondary lower top. This usually indicates the selling is becoming greater than the buying at current price levels. Also, it is often viewed as a precursor to a change in trend.
An early look at the price action suggests a downside bias could develop on Monday on a sustained move under 25938, while a sustained move over 26298 is likely to signal a resumption of the rally.
For a look at all of today’s economic events, check out our economic calendar.
James Hyerczyk is a U.S. based seasoned technical analyst and educator with over 40 years of experience in market analysis and trading, specializing in chart patterns and price movement. He is the author of two books on technical analysis and has a background in both futures and stock markets.