
Advertisement
Advertisement
E-mini NASDAQ-100 Index (NQ) Futures Technical Analysis – August 25, 2015 Forecast
By:
September E-mini NASDAQ-100 Index futures are trading better during the pre-market session after Monday’s massive sell-off. Oversold technical conditions
September E-mini NASDAQ-100 Index futures are trading better during the pre-market session after Monday’s massive sell-off. Oversold technical conditions and better conditions in Asia are helping to contribute to the rebound rally. The main trend is down, but momentum appears to be shifting to the upside. Fear and uncertainty are still driving the market, however, it looks as if value-seekers have stepped in to stabilize trading conditions. Nonetheless, volatility is still in the air.
Weekly Analysis
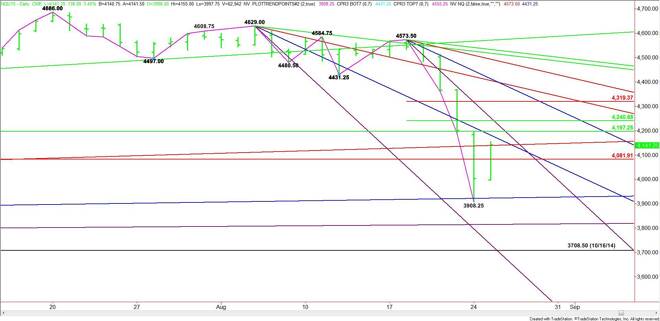
The main trend is down on the weekly chart. The main range is 3708.50 to 4686.00. Its retracement zone is 4197.25 to 4082.00. The market is currently trading inside the retracement zone. Trader reaction to this zone should set the tone of the market the rest of the week.
Look for a bullish tone to develop on a sustained move over 4197.25. The first target is a steep downtrending angle at 4365.00.
A bearish tone is likely to develop on a sustained move under the Fibonacci level at 4082.00. Look for an acceleration to the downside if the uptrending angle at 4068.50 fails as support. This could trigger a steep break into the next uptrending angle at 3888.50. This is followed by another angle at 3798.50. This is the last angle before the 3708.50 main bottom.
Daily Analysis
The main trend is down on the daily chart, but momentum appears to be shifting to the upside based on the pre-market trade. The short-term range is 4573.50 to 3908.25. Its retracement zone at 4241.00 to 4319.50 is the primary upside objective.
Based on the pre-market trade, the direction of the market after the opening will be determined by trader reaction to the uptrending angle at 4138.75. The rally could be labored, however, because of potential resistance at 4181.00, 4197.25, 4241.00 and 4253.50.
The daily chart opens up over 4253.50 with the next target a Fibonacci level at 4319.50. This is also a potential trigger point for a further rally into a loose price cluster at 4405.00 to 4413.50.
Watch the price action and read the order flow at 4138.75. This will tell us whether the bulls or the bears are in control.
About the Author
James Hyerczykauthor
James Hyerczyk is a U.S. based seasoned technical analyst and educator with over 40 years of experience in market analysis and trading, specializing in chart patterns and price movement. He is the author of two books on technical analysis and has a background in both futures and stock markets.


Advertisement