
Advertisement
Advertisement
E-mini NASDAQ-100 Index (NQ) Futures Technical Analysis – November 10, 2015 Forecast
By:
December E-mini NASDAQ-100 Index futures are trading lower shortly before the regular session opening. The index is trading inside yesterday’s range so
December E-mini NASDAQ-100 Index futures are trading lower shortly before the regular session opening. The index is trading inside yesterday’s range so there was no follow-through to the downside following Monday’s sharp break.
The inability to follow-through to the downside suggests there may be one more rally coming. The first leg down is usually longs exiting their positions. Short-sellers usually come in on the next rally.
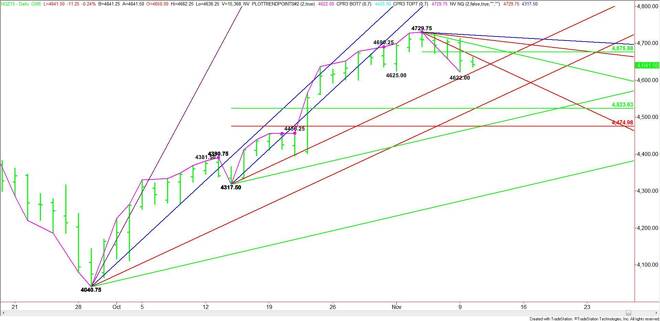
The main trend is up according to the daily swing chart. The minor trend, however, turned down when the minor bottom at 4625.00 was taken out.
The new short-term range is 4729.75 to 4622.00. Its 50% level or pivot comes in at 4676.00. This price is the primary upside target. Trader reaction to this level will likely determine the direction of the market over the near-term. Bullish traders are going to try to take it out in an effort to form a new bottom at 4622.00. Bearish traders are going to try to form a potentially bearish secondary lower top.
The main range is 4317.50 to 4729.75. Its retracement zone at 4523.50 to 4475.00 is the primary downside target.
Based on the close at 4652.75, the first upside target is a downtrending angle at 4665.75. Overtaking this angle is likely to drive the market into the pivot at 4676.00. Overtaking this pivot could lead to a rally into a set of downtrending angles at 4697.75, 4713.75 and 4721.75.
The first downside target is yesterday’s low at 4622.00. This is followed by an uptrending angle at 4621.50. This angle is also a trigger point for an acceleration to the downside.
A sustained move under 4621.50 fuel a huge sell-off with the next potential targets the main 50% level at 4523.50 and a long-term uptrending angle at 4520.75.
If the index is getting ready to break then counter-trend sellers should start to come in on a test of 4676.00. If they do and a secondary lower top forms then look for the selling pressure to eventually lead to a test of the retracement zone at 4523.50 to 4475.00. This zone is the primary downside target as well as a value area.
About the Author
James Hyerczykauthor
James Hyerczyk is a U.S. based seasoned technical analyst and educator with over 40 years of experience in market analysis and trading, specializing in chart patterns and price movement. He is the author of two books on technical analysis and has a background in both futures and stock markets.


Advertisement