
Advertisement
Advertisement
E-mini Russell 2000 Index (TF) Futures Technical Analysis – November 23, 2015 Forecast
By:
December E-mini Russell 2000 Index futures are trading flat during the pre-market session. The market is also straddling the upper or Fibonacci level of a
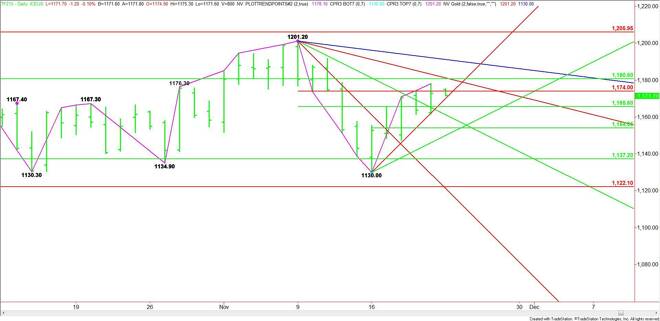
December E-mini Russell 2000 Index futures are trading flat during the pre-market session. The market is also straddling the upper or Fibonacci level of a resistance zone. Trader reaction to this level will likely dictate the direction of the market today. Volume could be light today as investors prepare for Thursday’s U.S. bank holiday. This could make it risky buying strength and selling weakness. Additionally, you’ll have to be prepared for periodic spike moves due to the thin trading conditions.
Technically, the main trend is down according to the daily swing chart. The main range is 1201.20 to 1130.00. Its retracement zone is 1165.60 to 1174.00. Trader reaction to this zone is likely to determine the direction of the market over the near-term. Trader reaction to the Fib level at 1174.00 will likely determine the direction of the market today.
Based on Friday’s close at 1172.90, the first key level to watch is the Fib level at 1174.00.
A sustained move over 1174.00 will indicate the presence of buyers. The first minor target is Friday’s high at 1178.10. This is followed by the resistance cluster at 1180.60 to 1181.20.
The resistance cluster is also a potential trigger point for an upside breakout with the next target a downtrending angle at 1191.20. This is the late potential resistance angle before the 1201.20 main top.
A sustained move under 1174.00 will signal the presence of sellers. The first target is an uptrending angle at 1170.00. Breaking this angle will likely trigger a break into the 50% level at 1165.60.
Breaking 1165.60 and crossing to the weak side of a downtrending angle at 1161.20 will likely lead to further downside action with 1154.00 the primary downside target.
Watch the price action and read the order flow at 1174.00 today. Trader reaction to this level will tell us whether the bulls or the bears are in control.
About the Author
James Hyerczykauthor
James Hyerczyk is a U.S. based seasoned technical analyst and educator with over 40 years of experience in market analysis and trading, specializing in chart patterns and price movement. He is the author of two books on technical analysis and has a background in both futures and stock markets.


Advertisement