
Advertisement
Advertisement
E-mini Russell 2000 Index (TF) Futures Technical Analysis – October 22, 2014 Forecast
By:
December E-mini Russell 2000 Index futures turned the main trend to up on the daily chart when it took out the last two swing tops at 1101.20 and 1106.50.
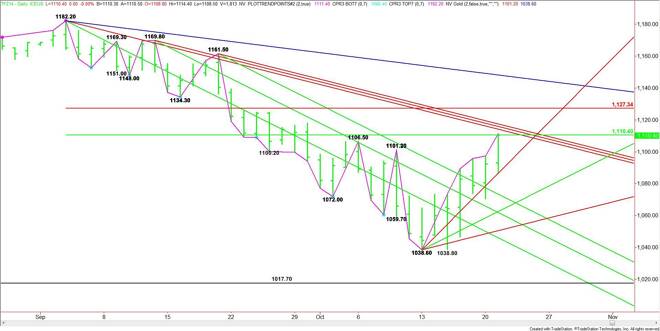
December E-mini Russell 2000 Index futures turned the main trend to up on the daily chart when it took out the last two swing tops at 1101.20 and 1106.50. The rally was stalled at a major 50% level and shortly before a series of long-term downtrending angles.
The main range is 1182.20 to 1038.60. The retracement zone formed by this range is 1110.40 to 1127.30. The lower or 50% level at 1110.40 stopped the rally on Tuesday.
Crossing to the strong side of the 50% level may not trigger a breakout to the upside since a series of downtrending angles at 1112.20, 1113.80 and 1115.50 could stop the rally.
If 1115.50 is taken out with conviction then look for the rally to extend into the Fibonacci level at 1127.30.
Today is the seventh day up from the 1038.60 bottom, putting the index in a position to form a closing price reversal top. In other words, watch for selling pressure. It could be profit-taking or counter-trend shorting.
A sustained move under the 50% level at 1110.40 could trigger a decline into the nearest support angle at 1094.60.
Look for a bias to the upside if 1110.40 is overtaken, but don’t expect an acceleration to the upside unless 1115.50 is taken out with conviction. Watch for signs of topping action on the intraday charts if traders can’t take out the series of resistance angles and can’t hold the 50% level at 1110.40.
About the Author
James Hyerczykauthor
James Hyerczyk is a U.S. based seasoned technical analyst and educator with over 40 years of experience in market analysis and trading, specializing in chart patterns and price movement. He is the author of two books on technical analysis and has a background in both futures and stock markets.


Advertisement