September E-mini S&P 500 Index futures are expected to open lower based on the pre-market trade. The index is currently testing a pair of 50% levels.
September E-mini S&P 500 Index futures are expected to open lower based on the pre-market trade. The index is currently testing a pair of 50% levels. Trader reaction to these levels will determine the direction of the market today and perhaps over the near-term.
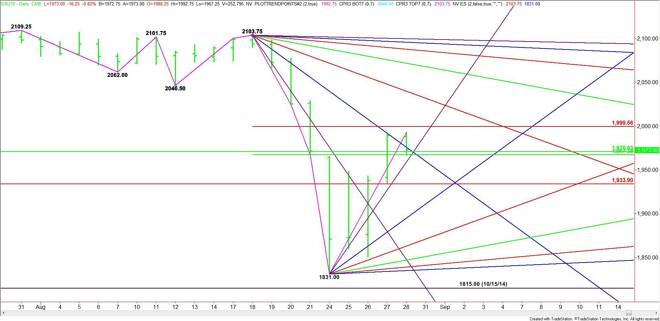
The main trend is down according to the daily swing chart. The main range is 1815.00 to 2126.25. The short-term range is 2103.75 to 1831.00. Its retracement zone is 1967.50 to 1999.50. The key area to watch is the price cluster formed by the two 50% levels at 1967.25 to 1970.50. The pre-market high at 1992.75 fell inside the short-term retracement zone.
Two angles are also coming into play. The downtrending angle comes in at 1975.25 and the uptrending angle comes in at 1959.00.
On the downside, the first sign of weakness will be crossing to the bearish side of the two 50% levels at 1970.50 and 1967.25. However, don’t expect an acceleration to the downside unless the angle at 1959.00 is taken out with conviction.
A failure to hold 1959.00 could create enough downside momentum to challenge the next potential support at 1934.00. This price is also a potential trigger point for an acceleration into the nearest support angle at 1895.00.
Holding above 1970.75 will signal the presence of buyers. Look for a possible acceleration to the upside on a sustained move over a steep downtrending angle at 1975.75. This could create enough upside momentum to challenge a Fibonacci level at 1999.50.
The Fib level is a potential trigger point for an acceleration to the upside with 2039.75 the next potential upside target.
Traders should also keep an eye on last week’s close at 1971.50. This price may act like a pivot today.
Watch the price action and read the order flow at 1975.75 and 1959.00. Look for a bullish tone to develop over 1975.75 and a bearish tone to develop on a sustained move under 1959.00.
James Hyerczyk is a U.S. based seasoned technical analyst and educator with over 40 years of experience in market analysis and trading, specializing in chart patterns and price movement. He is the author of two books on technical analysis and has a background in both futures and stock markets.