
Advertisement
Advertisement
E-mini S&P 500 Index (ES) Futures Technical Analysis – October 23, 2014, Forecast
By:
December E-mini S&P 500 Index traders drove the market through a Fibonacci level early in the session on Wednesday, but the move failed to generate
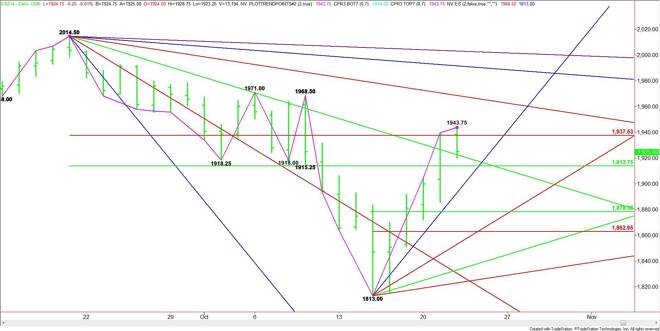
A trade through 1920.25 will confirm the closing price reversal top and could trigger the start of a meaningful correction. The short-term range is 1813.00 to 1943.75. Its retracement zone at 1878.25 to 1863.00 is the primary downside target.
The main range is 2014.50 to 1813.00. Its retracement zone at 1913.75 to 1937.50 essentially stopped the rally on Wednesday. Based on the close at 1925.00, the upper or Fibonacci level at 1937.50 is the nearest resistance, followed by the reversal top at 1943.75.
Crossing to the weak side of a downtrending angle at 1918.50 will be the first sign of weakness. This could trigger a break into the lower or 50% level at 1913.75. Taking this level out could trigger an acceleration into a steep uptrending angle at 1909.00.
The index opens up on the daily chart under 1909.00 with the 50% level at 1878.25 the primary target.
A trade through 1943.75 will negate the closing price reversal top. This could trigger an acceleration to the upside with the next target a downtrending angle at 1861.00, followed by a pair of tops at 1868.50 and 1971.00.
Yesterday’s price action and lower close was triggered by an outside event, proving once again that investors are a little nervous. Look for a bullish tone today over 1943.75 and a bearish tone to develop under 1913.75. Otherwise, expect sideways action inside 1913.75 to 1943.75.
About the Author
James Hyerczykauthor
James Hyerczyk is a U.S. based seasoned technical analyst and educator with over 40 years of experience in market analysis and trading, specializing in chart patterns and price movement. He is the author of two books on technical analysis and has a background in both futures and stock markets.


Advertisement