It's a bearish start to the day for the majors. Failure to revisit early highs would bring support levels into play.
Ethereum fell by 3.22% on Friday. Reversing a 1.75% gain from Thursday, Ethereum ended the day at $1,767.79.
A mixed start to the day saw Ethereum rise to an early morning high $1,841.96 before hitting reverse.
Falling short of the first major resistance level at $1,874, Ethereum slid to an early afternoon intraday low $1,721.15.
The sell-off saw Ethereum fall through the first major support level at $1,752 before finding support.
Steering clear of sub-$1,700 levels, Ethereum revisited $1,780 levels before easing back.
At the time of writing, Ethereum was down by 1.24% to $1,745.92. A mixed start to the day saw Ethereum rise to an early morning high $1,768.82 before falling to a low $1,745.47.
Ethereum left the major support and resistance levels untested early on.
Ethereum would need to move through the pivot level at $1,777 to support a run at the first major resistance level at $1,833.
Support from the broader market would be needed, however, for Ethereum to break back through to $1,800 levels.
Barring an extended crypto rally, the first major resistance level and Friday’s high $1,841.96 would likely cap any upside.
In the event of a breakout, Ethereum could test resistance at $1,900 before any pullback. The second major resistance level sits at $1,898.
Failure to move through the $1,777 pivot would bring the first major support level at $1,712 into play.
Barring an extended sell-off, however, Ethereum should steer clear of sub-$1,650 levels. The second major support level at $1,656 should limit the downside.
First Major Support Level: $1,712
Pivot Level: $1,777
First Major Resistance Level: $1,833
23.6% FIB Retracement Level: $1,579
38.2% FIB Retracement Level: $1,292
62% FIB Retracement Level: $830
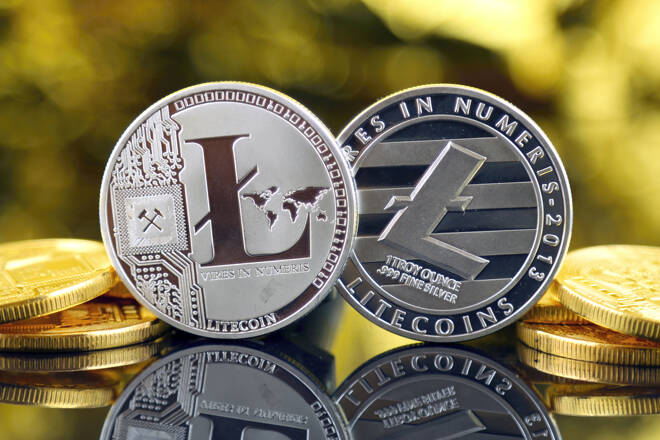
Litecoin rallied by 9.61% on Friday. Following a 0.57% gain on Thursday, Litecoin ended the day at $220.84.
A mixed start to the day saw Litecoin rise to a late morning high $215.10 before hitting reverse.
Litecoin broke through the first major resistance level at $206 and the second major resistance level at $211.
The reversal saw Litecoin slide to an early afternoon intraday low $198.67 before finding support.
Steering clear of the 23.6% FIB of $195 and the first major support level at $194, Litecoin rallied to a late intraday high $224.33.
Litecoin broke through the day’s major resistance levels before falling back through the third major resistance level at $223.
At the time of writing, Litecoin was down by 1.23% to $218.12. A mixed start to the day saw Litecoin rise to an early morning high $221.37 before falling to a low $217.70.
Litecoin left the major support and resistance levels untested early on.
Litecoin would need to avoid a fall through the $215 pivot level to support a run at the first major resistance level at $231.
Support from the broader market would be needed, however, for Litecoin to break out from Friday’s high $224.33.
Barring an extended crypto rally, the first major resistance level would likely cap any upside.
In the event of an extended rally, Litecoin could test resistance at $245 before any pullback. The second major resistance level sits at $240.
Failure to avoid a fall through the $215 pivot level would bring the first major support level at $205 into play.
Barring an extended sell-off, Litecoin should steer clear of the second major support level at $189. The 23.6% FIB of $195 should limit the downside.
First Major Support Level: $205
Pivot Level: $215
First Major Resistance Level: $231
23.6% FIB Retracement Level: $195
38.2% FIB Retracement Level: $163
62% FIB Retracement Level: $110
Ripple’s XRP fell by 2.80% on Friday. Following on from a 2.06% decline on Thursday, Ripple’s XRP ended the day at $0.43941.
A mixed start saw Ripple’s XRP rise to an early morning intraday high $0.46441 before hitting reverse.
Ripple’s XRP broke through the 38.2% FIB of $0.4632 and the first major resistance level at $0.4636.
The reversal saw Ripple’s XRP slide to an early afternoon intraday low $0.42330. Ripple’s XRP fell through the first major support level at $0.4408 and the second major support level at $0.4295.
Finding early afternoon support on, Ripple’s XRP revisited $0.448 levels before a second pullback.
Ripple’s XRP fell back through the first major support level at $0.4408 to end the day at sub-$0.44 levels.
At the time of writing, Ripple’s XRP was down by 0.79% to $0.43595. A mixed start to the day saw Ripple’s XRP rise to an early morning high $0.43843 before falling to a low $0.43500.
Ripple’s XRP left the major support and resistance levels untested early on.
Ripple’s XRP will need to move through the $0.4424 pivot level to bring the first major resistance level at $0.4614 and the 38.2% FIB of $0.4632 into play.
Support from the broader market would be needed, however, for Ripple’s XRP to break back through to $0.46 levels.
Barring an extended crypto rally, the first major resistance level and 38.2% FIB would cap any upside.
In the event of an extended rally, Ripple’s XRP could test resistance at $0.48 before any pullback. The second major resistance level sits at $0.4835.
Failure to move through the $0.4424 pivot would bring the first major support level at $0.4203 into play.
Barring another extended sell-off, however, Ripple’s XRP should steer clear of sub-$0.40 levels. The second major support level at $0.4013 should limit the downside.
First Major Support Level: $0.4203
Pivot Level: $0.4424
First Major resistance Level: $0.4614
23.6% FIB Retracement Level: $0.5320
38.2% FIB Retracement Level: $0.4632
62% FIB Retracement Level: $0.3521
Please let us know what you think in the comments below.
Thanks, Bob
With over 28 years of experience in the financial industry, Bob has worked with various global rating agencies and multinational banks. Currently he is covering currencies, commodities, alternative asset classes and global equities, focusing mostly on European and Asian markets.