


Ethereum (ETH) has shed nearly 3% of its value in the past 24 hours after failing to climb above $1,900 multiple times in these past few days.
The crypto market has been relatively muted lately, as traders await further clarity regarding the Clarity Act in the United States after lawmakers went into the summer recess.
A hawkish Federal Reserve and low interest in the crypto space as a whole remain strong headwinds that have prevented prices from pushing past key resistances.
However, we saw another attempt from bulls last week to push ETH out of its consolidation pattern.
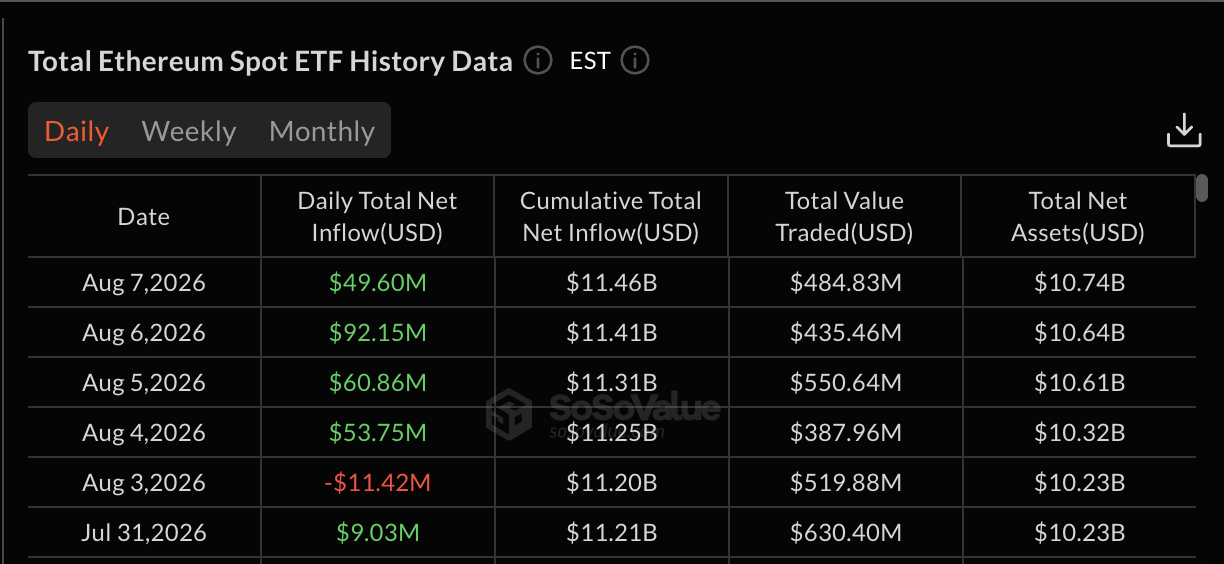
Last week, net inflows to exchange-traded funds (ETFs) surged to $244 million — the largest weekly print since April 2026. This indicates that investors bought into the latest rebound off the $1,840 support with the expectation that the $1,900 ceiling would be broken this time.
However, today’s decline seems to confirm that the selling pressure is still strong at that level.
We continue to see a worrying downtrend in trading volumes for ETH, indicating that market participants have shunned cryptocurrencies and have rotated their capital toward more promising areas of the tech space like space travel and artificial intelligence (AI).
Ethereum Trading Volumes Dip to 3-Year Lows
According to data from Santiment, the 7-day moving average for volumes dropped to its lowest print since November 2023 — back when ETH traded at around $2,200.
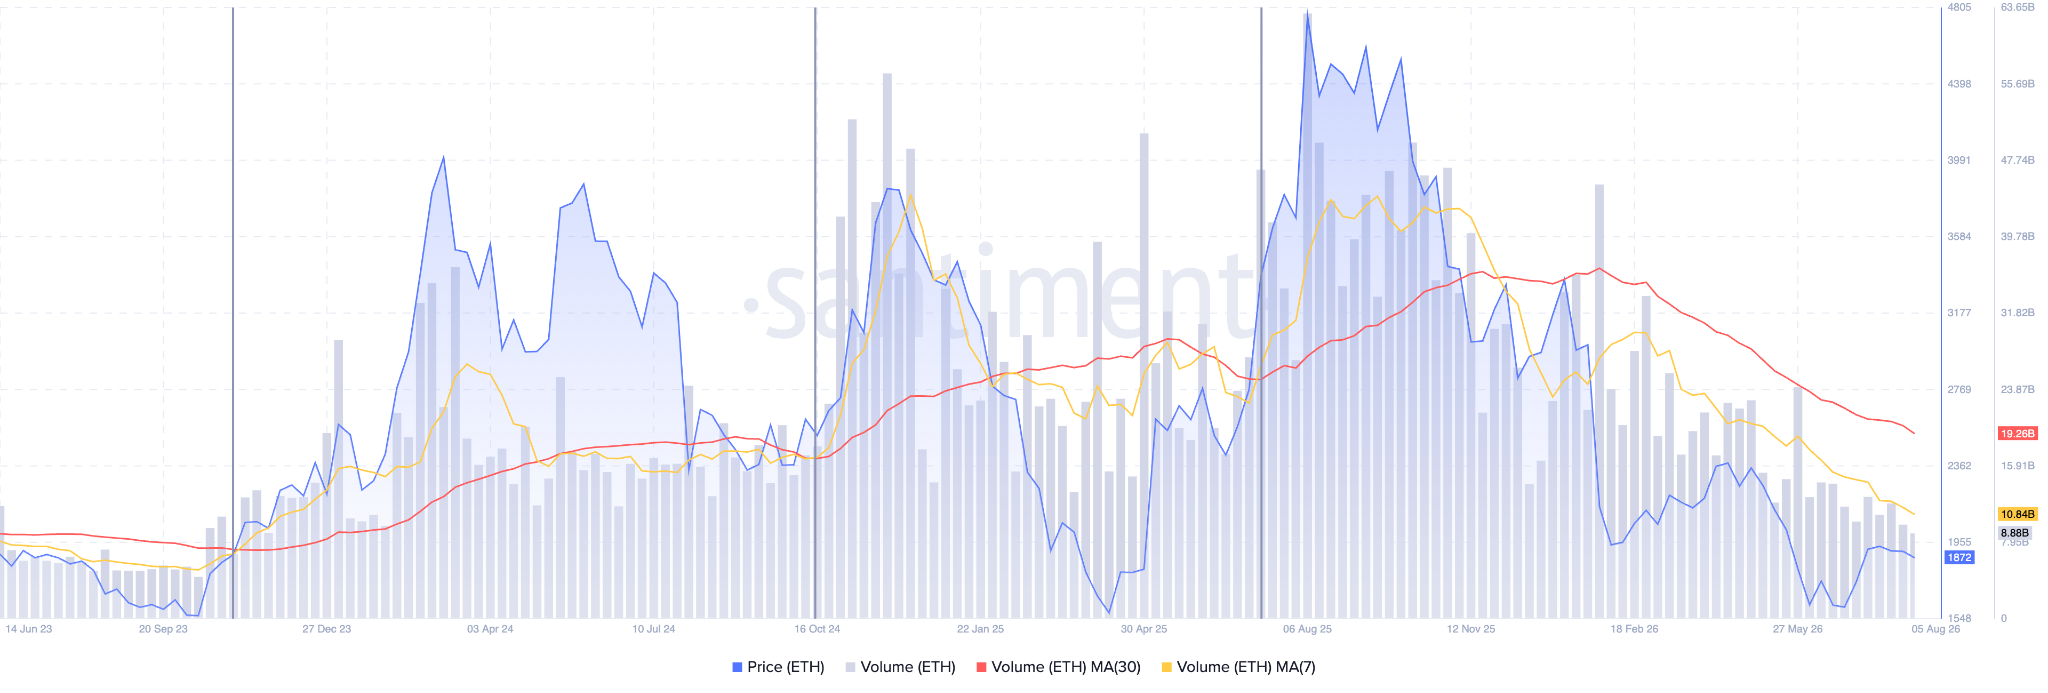
The only difference is that volumes were on an uptrend back then, while they are currently on a strong downtrend.
As we have stated in previous Ethereum price prediction articles, the market needs a strong positive catalyst to break past its current ceilings. The Clarity Act should supposedly be that, but the odds of passing that bill into law right now are significantly low as per Polymarket bets.
At 26%, the chances of passing have recovered from a recent low of 14%. However, this is still quite a low level for a critical piece of legislation that could help shape the future of cryptocurrencies in the United States and overseas.
Ethereum Price Forecast
Every new Ethereum analysis as it publishes, today's technical signal and key levels, live price — on one page.
See all Ethereum forecastsBullish Flag Pattern Still in Play Despite Today’s Drop
The daily chart shows that ETH could be heading to retest the lower bound of a consolidation rectangle that has formed since the token broke past the $1,800 resistance. A bullish flag pattern has emerged as a result, which is a classic continuation setup that remains in play as long as ETH stays above $1,840.
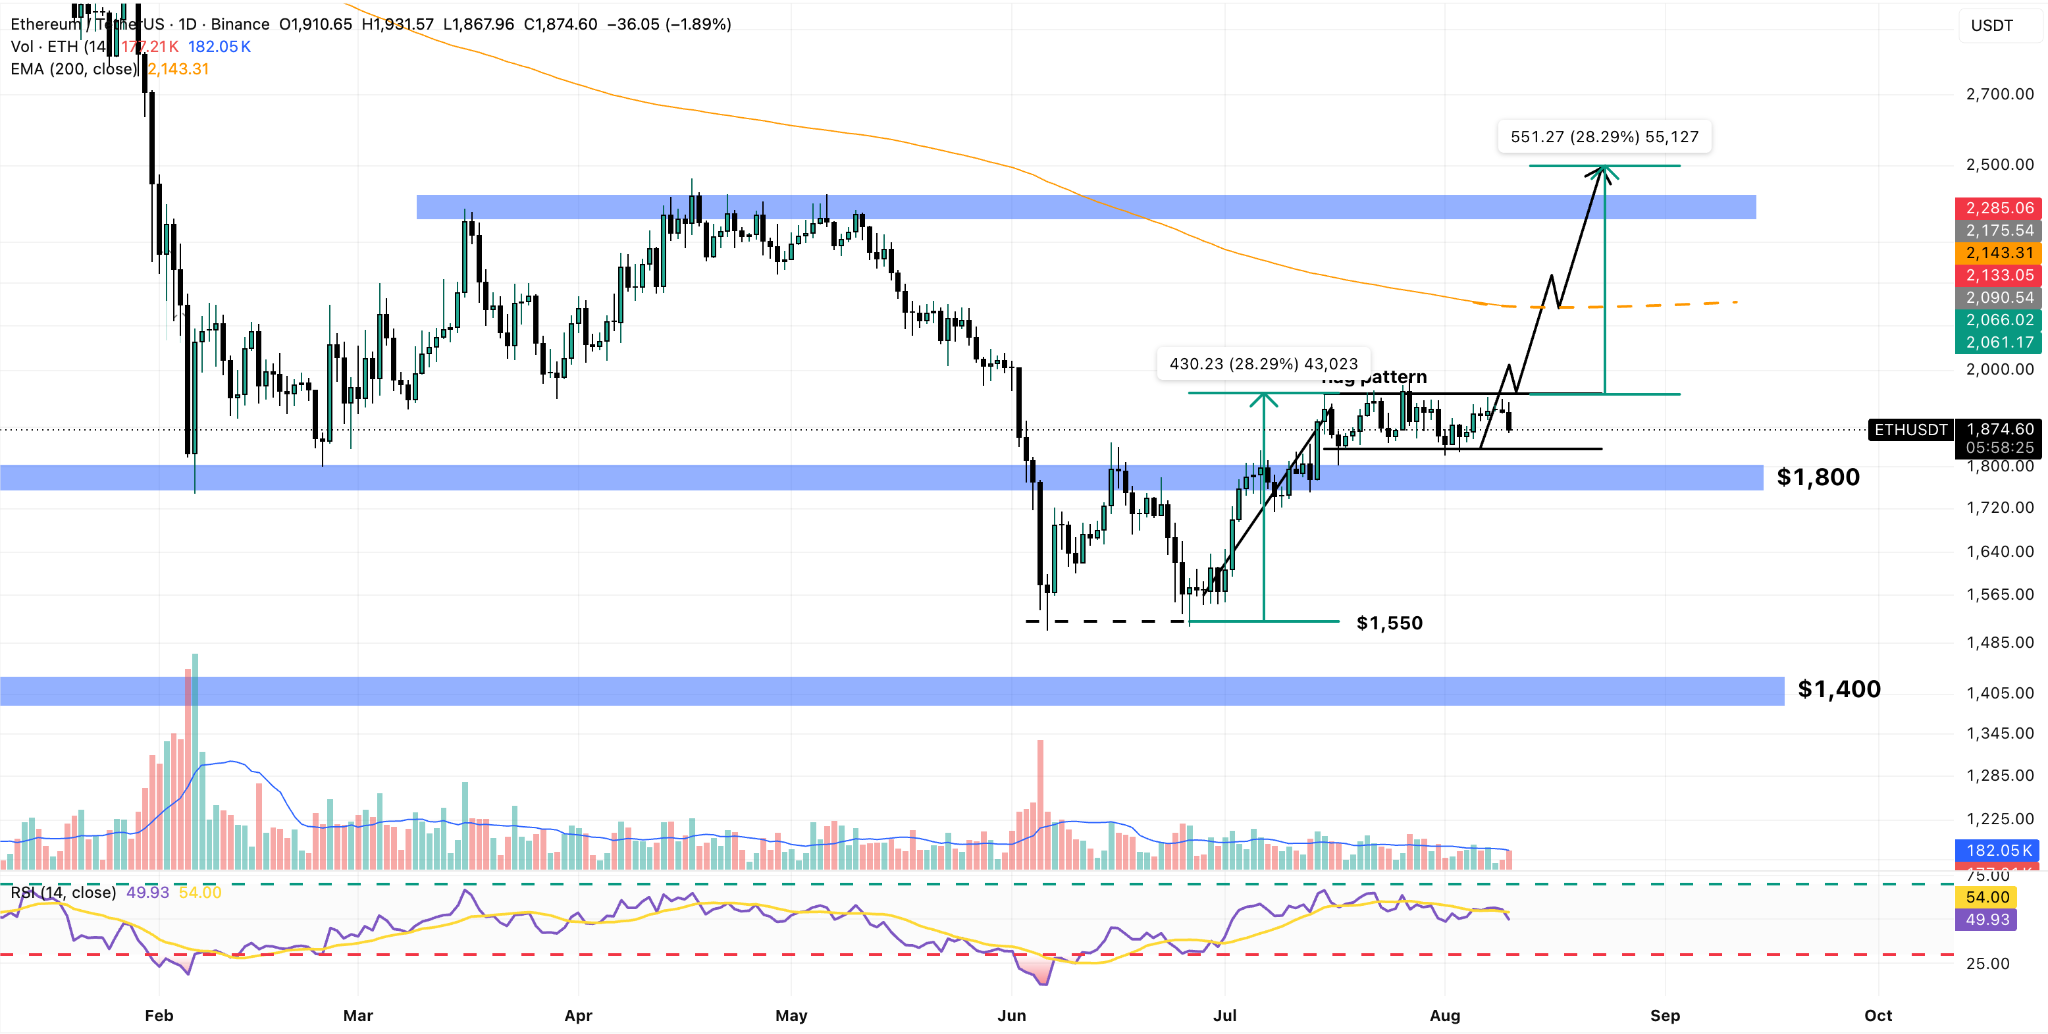
Based on the size of the flag’s pole, ETH could rise to $2,500 if that consolidation setup is broken. For now, negative momentum is gaining traction as the Relative Strength Index (RSI) dropped below the signal line.
If this momentum indicator declines beyond 40, that would invalidate this bullish pattern and potentially set the stage for a retest of the $1,550 floor.
With trading volumes sitting at such thin levels, market makers have the upper hand and could aim at pushing ETH to critical price zones to find the necessary liquidity to trigger the next big move.
We see higher odds of a bullish breakout, as both technical indicators and on-chain data seem to indicate that we are either near or at this cycle’s bottom already.