


Ethereum (ETH) has been consolidating in the past few days, hovering between the $1,830 and $1,930 levels as volumes have dried up.
Data from CoinMarketCap shows that volumes have dropped by nearly 50% in the past couple of days compared to a recent peak of $14 billion in late July.
Following a promising breakout above the $1,800 resistance, the price action has stalled, and a flag pattern has formed as a result.
This is a typical consolidation setup that tends to show up after pronounced uptrends or downtrends, and it is usually considered a sign that the market will continue its current path after a brief pause.

Ethereum Trading Volumes Continue to Be Heavily Depressed
Just as the price action is stalled, sentiment is not moving in a clear direction either, and that explains why volumes have been drying up.
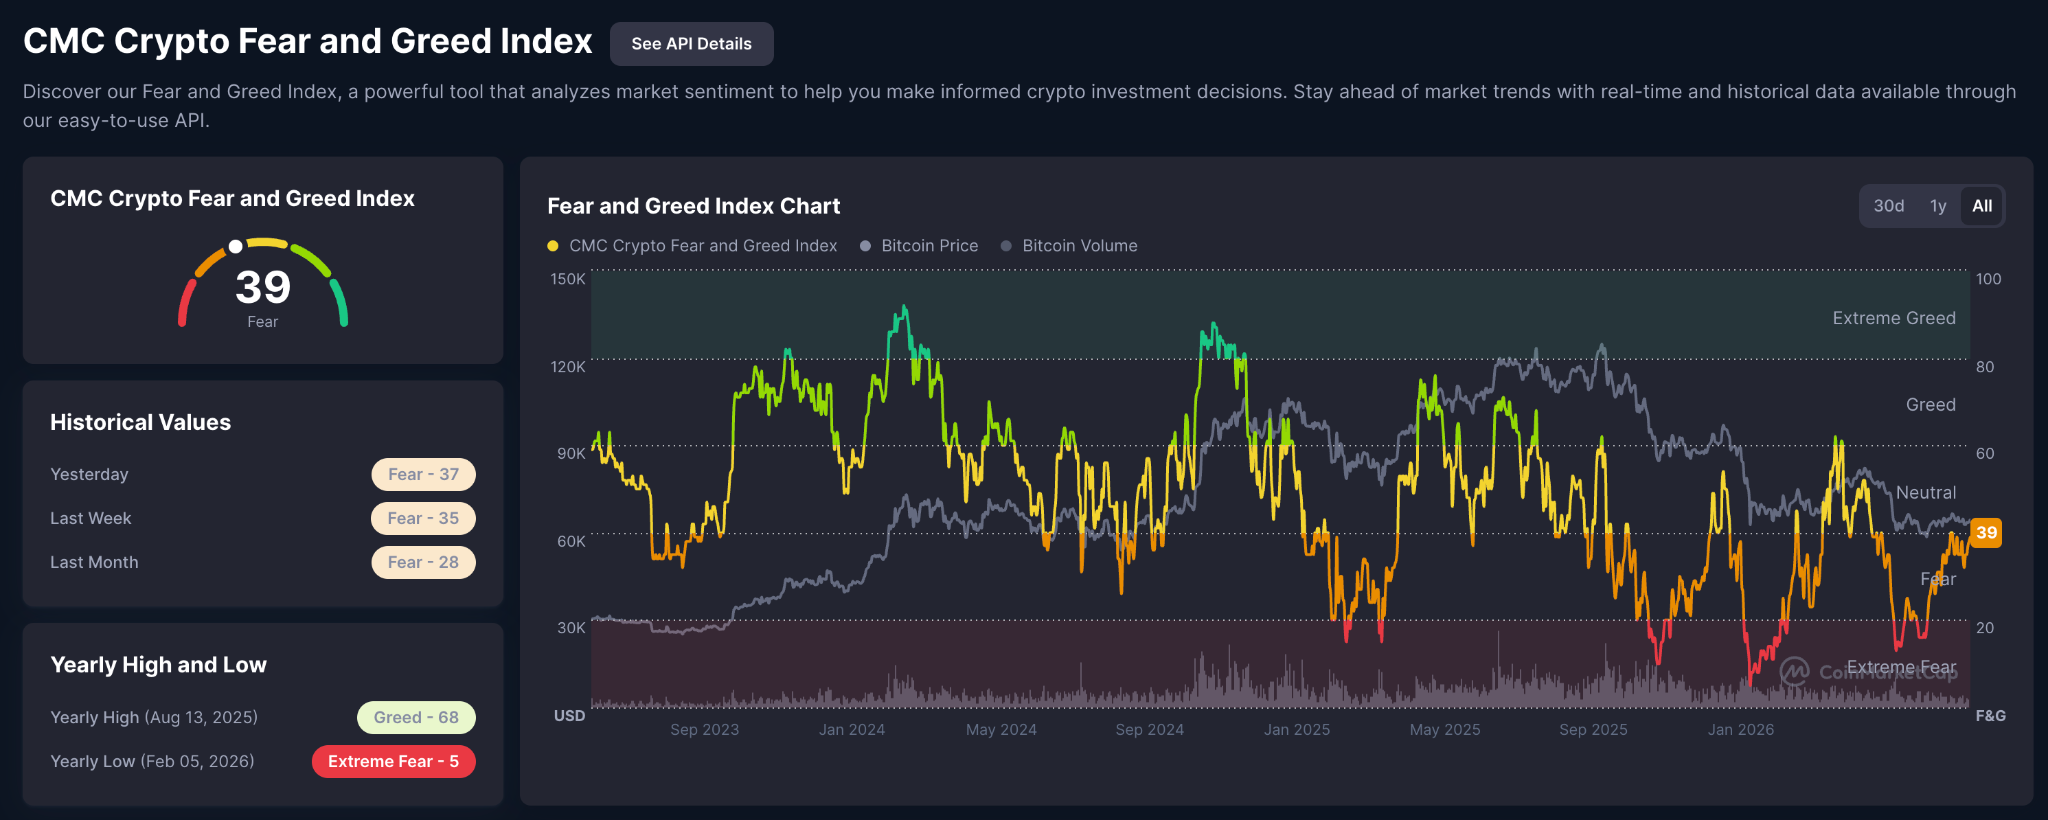
The Crypto Fear and Greed Index is currently stalled near Neutral territory at around 40, reflecting that market participants don’t believe that this latest rally could be the beginning of a true recovery for Ethereum yet.
This is the result of a challenging macroeconomic backdrop defined by strong expectations of an upcoming interest rate hike.
In addition, the absence of bullish price drivers like positive project-specific news, similar to what happened in April 2025 when the Pectra upgrade managed to put an end to ETH’s bear market, is keeping a lid on these rallies.
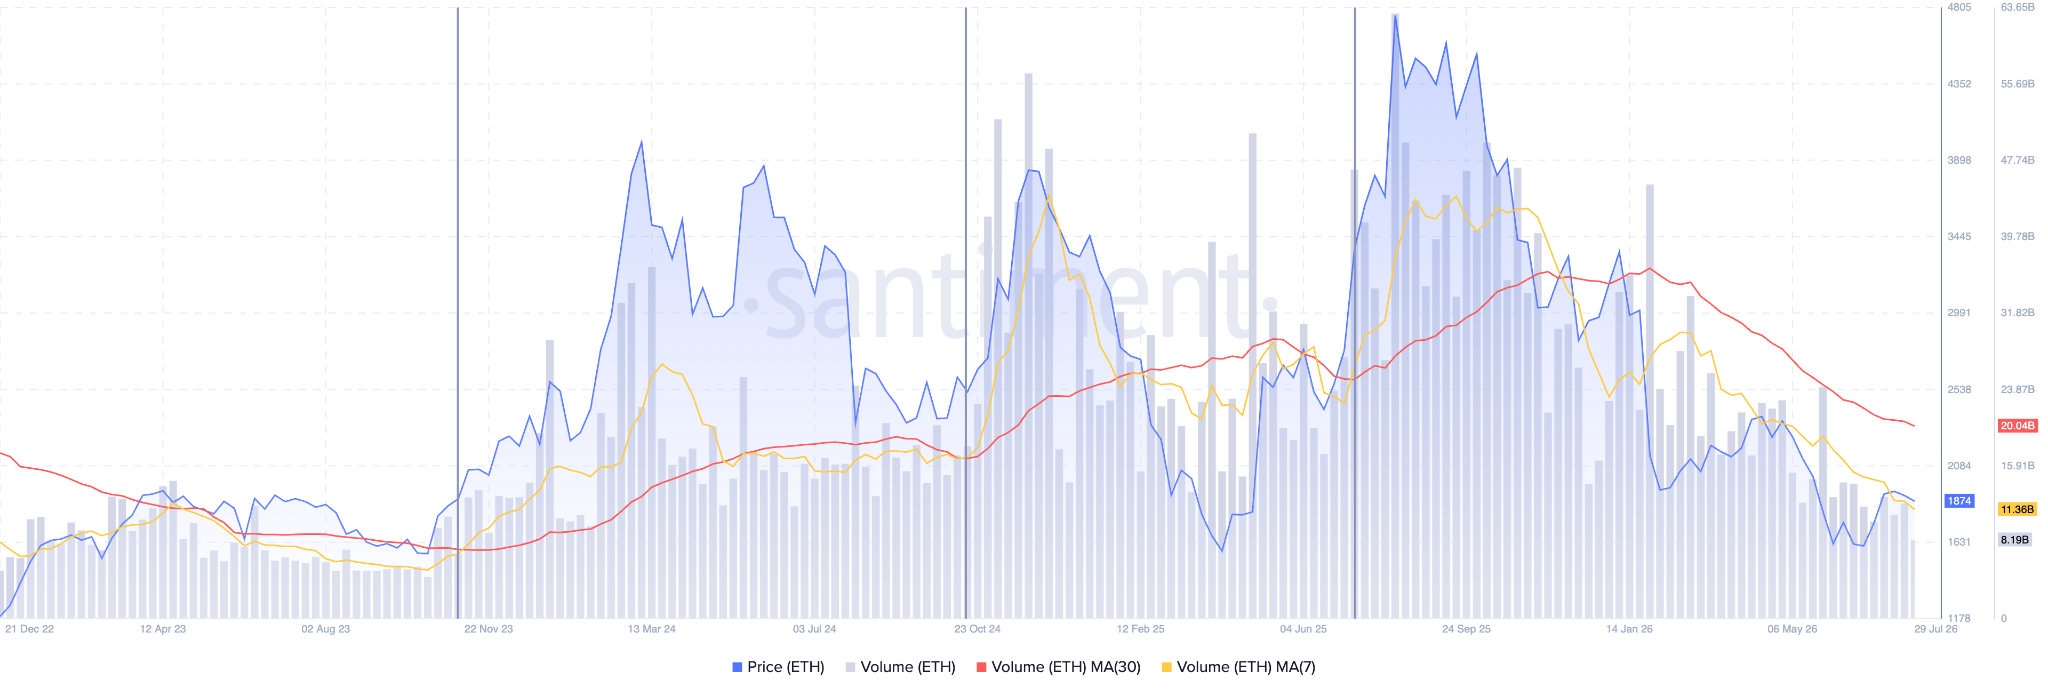
Trading volumes also indicate that the market is struggling to find direction. We have been keeping track of the 7-day and 30-day moving averages for volumes, as a crossover between these two lines has accurately marked the beginning of bullish and bearish market cycles.
Right now, the two lines are moving in parallel and remain pretty distanced from each other while they are both on a downtrend. What this indicates is that interest in ETH has waned, declining to its lowest level since December 2023.
Unless volumes make a comeback, this latest rally will struggle to reach new heights.
Ethereum Price Forecast
Every new Ethereum analysis as it publishes, today's technical signal and key levels, live price — on one page.
See all Ethereum forecastsBullish Flag Pattern Favors $2,500 Near-Term Target for ETH
Heading to the daily chart, we can see that a flag pattern has formed after ETH broke above the $1,800 resistance.
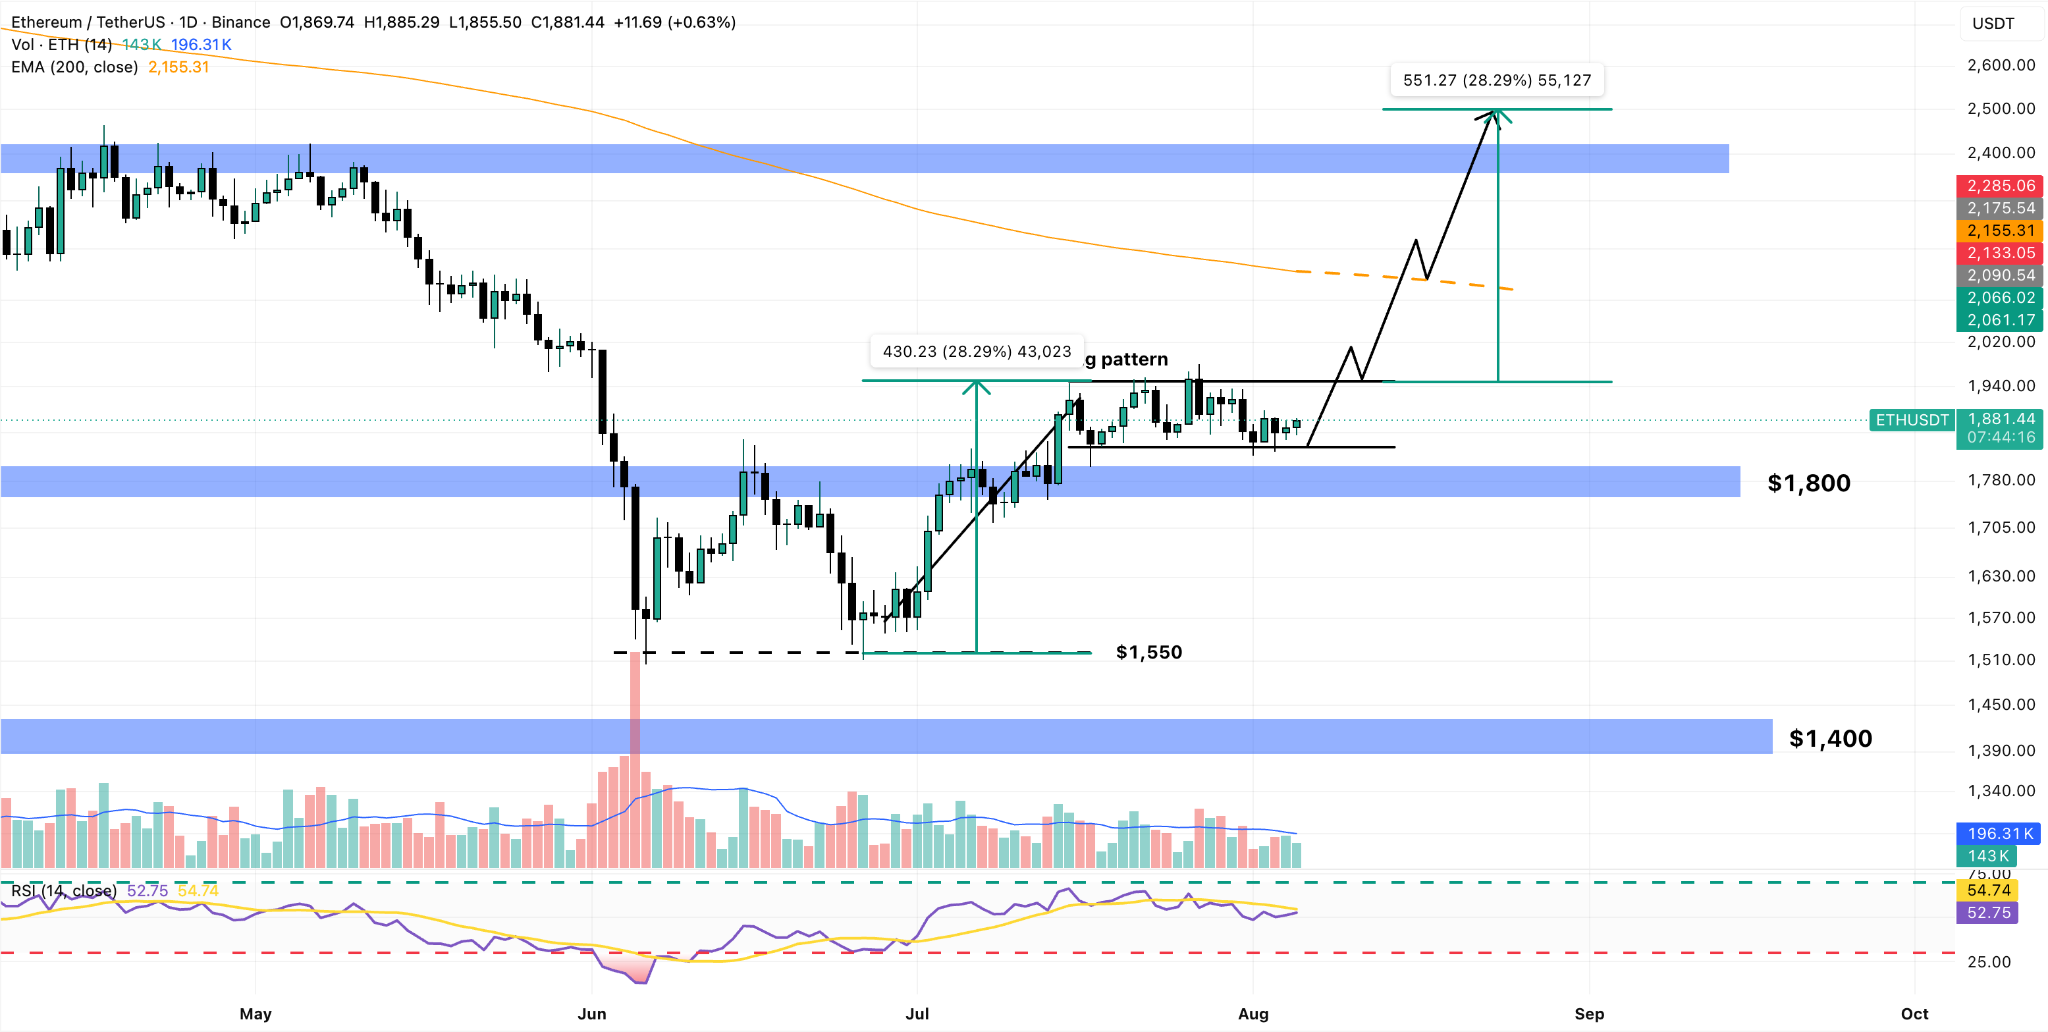
If bulls manage to push ETH past the $1,930 upper bound of the flag, our projection is that the price could reach $2,500 at least in the near term.
That would mean a breakout above the token’s long-term trend, the 200-day exponential moving average (EMA). This projected move also coincides with a strong horizontal resistance along the way, increasing the odds that this might be the ultimate target for the market if a breakout occurs.
The Relative Strength Index (RSI) has stood above 50 in the past few days. The oscillator would have to rise past 60, as that would send traders a clear signal that positive momentum is accelerating.
This market needs volumes desperately to get things moving, but those volumes are not here yet.



