Bitcoin (BTC) has gone up by 3% in the past 7 days but continues to trade relatively range-bound between $60,000 and $66,000 as the market struggles to find direction.
However, whales seem to be taking advantage of this sideways consolidation as they continue to add more BTC to their stash.
Just today, a European company called H100 announced that they completed the acquisition of a Bitcoin holding company called NSD AS, whose BTC holdings ascended to 2,455.37 tokens.
As a result, H100 has become the second-largest Bitcoin treasury on this continent, owning a total of 3,506.4 BTC to date.
The transaction reflects ongoing institutional interest in the top crypto despite its latest volatility and at a point when technical indicators and on-chain data seem to be indicating that a cycle bottom is already in or nearby.

Whales Have Added 30,000 BTC Tokens in August
Meanwhile, data from Santiment also shows that BTC whales have added 30,000 tokens to their holdings in the first 10 days of August.
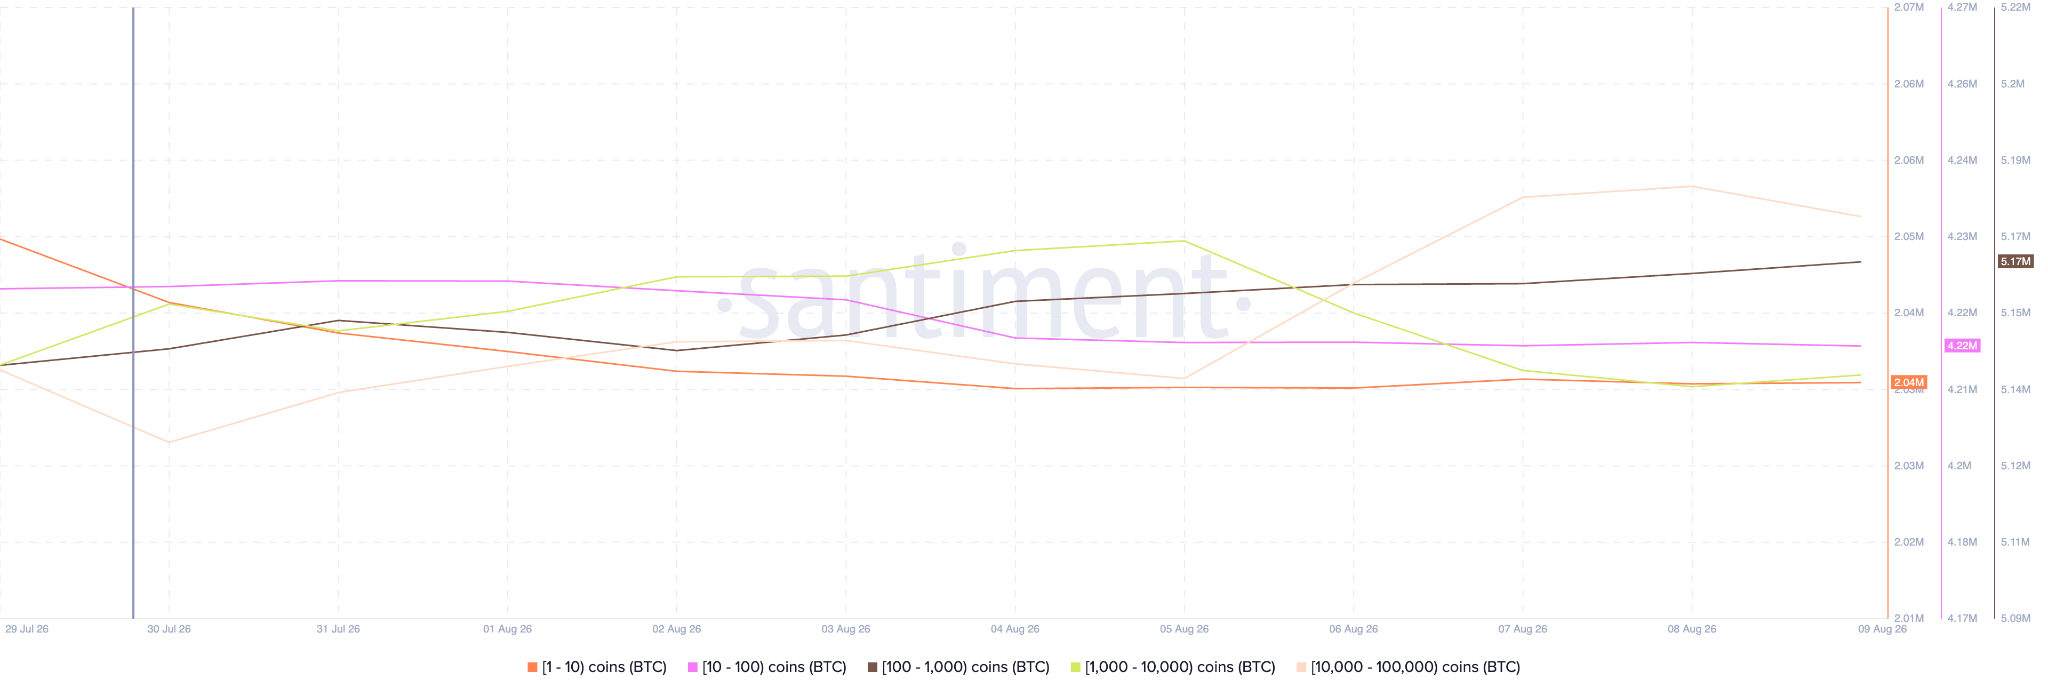
Wallets holding between 100 and 1,000 BTC bought 20,000 tokens while large whales in possession of a total ranging between 10,000 and 100,000 tokens added another 30,000 BTC.
This total was offset by 20,000 in withdrawals from whales holding between 1,000 and 10,000 BTC, which translates into a net inflow to these wallets of 30,000 BTC. At today’s price, these are valued at around $1.92 billion.
Last week, we also reported that investors deposited over $850 million into Bitcoin ETFs. As a result, monthly inflows increased significantly compared to the previous month.
Meanwhile, if August ends with positive inflows, that would reverse the strong downtrend that these vehicles experienced during May and June, back when investors withdrew over $6.9 billion from these vehicles.
Bitcoin Price Forecast
Every new Bitcoin analysis as it publishes, today's technical signal and key levels, live price — on one page.
See all Bitcoin forecastsBTC Could Reverse Its Downtrend If This Bullish Pattern Plays Out
As we have stated in previous Bitcoin price prediction articles, we are closely tracking a buy signal in the weekly chart that has marked the end of previous bear markets. This signal flashes whenever the Relative Strength Index (RSI) dips to 30 or lower in this higher time frame.
This already happened in March this year, back when BTC hit what we see as a potential cycle bottom at $60,000.
Heading to the daily chart, we continue to track how a bullish inverse head and shoulders plays out, as this is the dominant price pattern in this time frame.
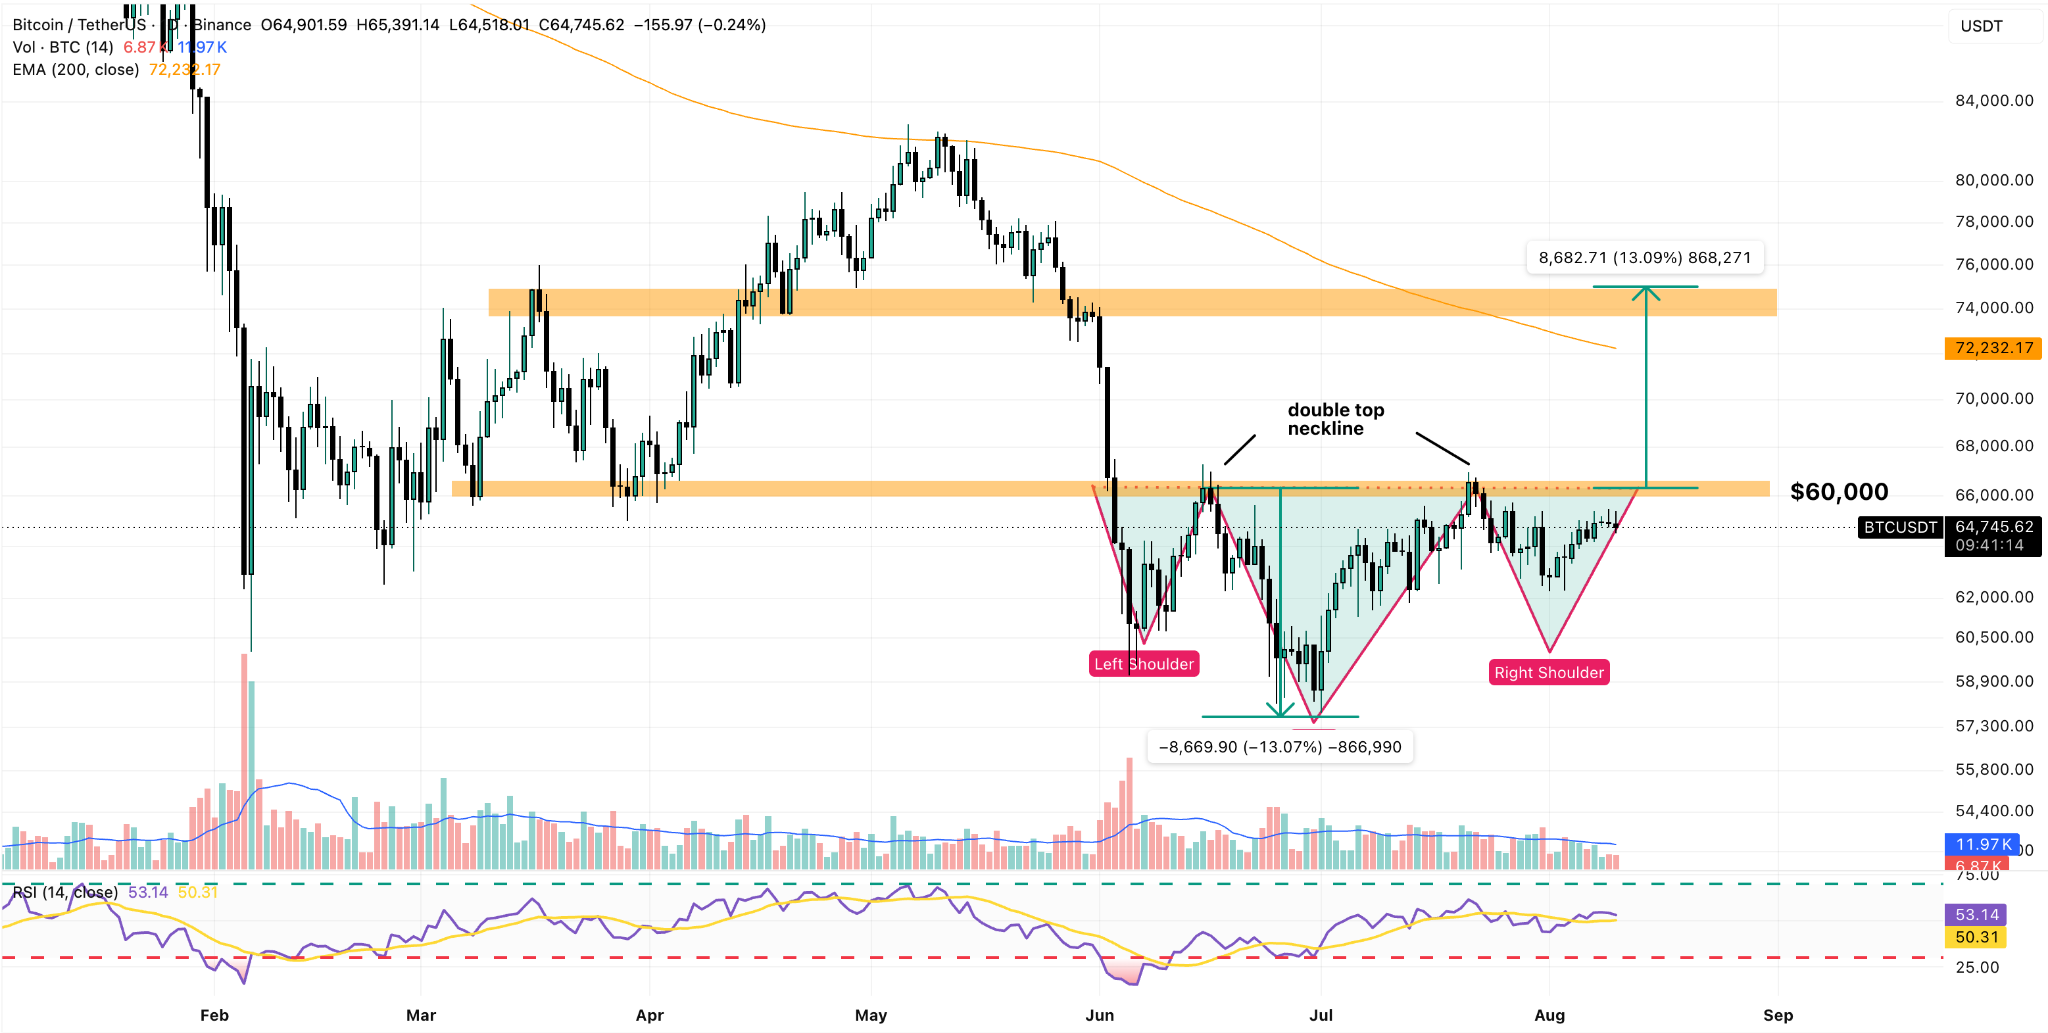
The neckline for this setup stands at $66,000. If this price zone is broken, that could set Bitcoin on track to retest its 200-day exponential moving average (EMA) at around $72,000.
Meanwhile, based on the pattern’s projected price target, BTC could break that long-term moving average if the setup is confirmed, as the move could push it to $75,000 in the next few weeks.
The Relative Strength Index (RSI) is still on the bullish end at 53, but needs to climb past 60 to confirm a buy signal.