
Initial Technical Warning
A rare technical setup on the S&P500 (SPX), combined with weakening market internals and our Elliott Wave Principle (EWP) count, is raising the possibility that the recent advance is stalling.
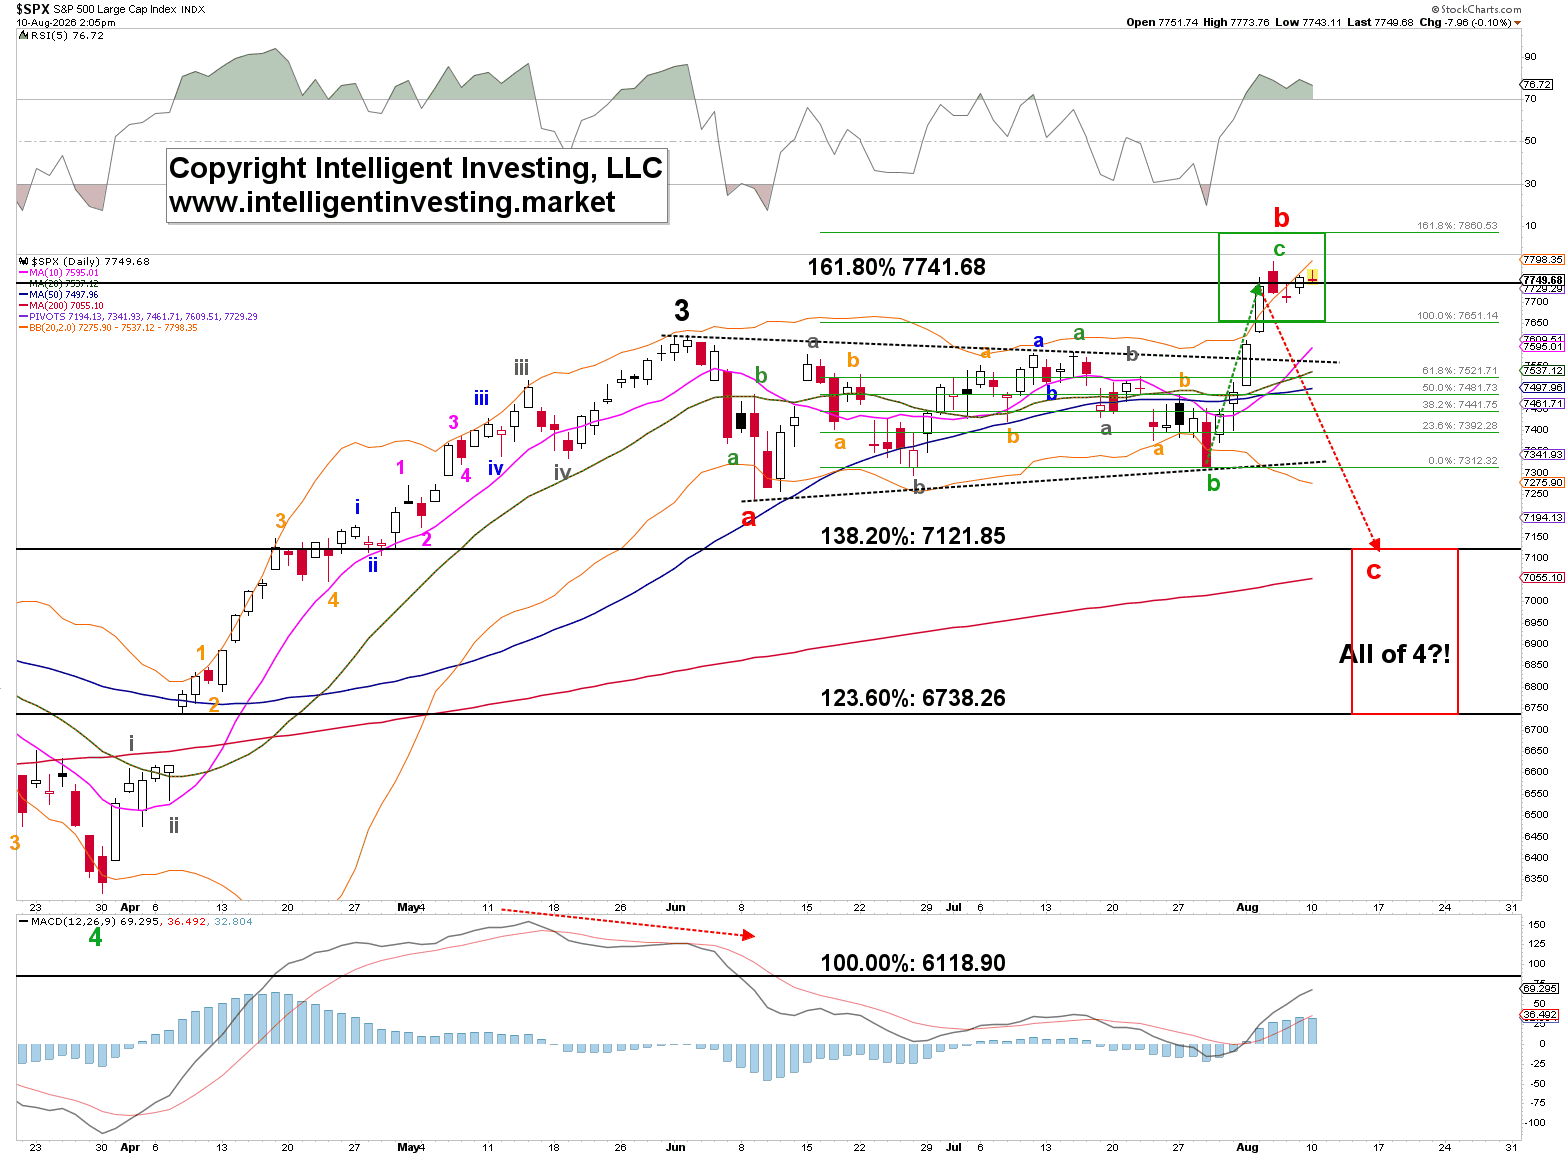
On August 5, the SPX recorded a daily session that traded entirely above the upper 20-day, 2-standard-deviation Bollinger Band (BB). See Figure 1 below.
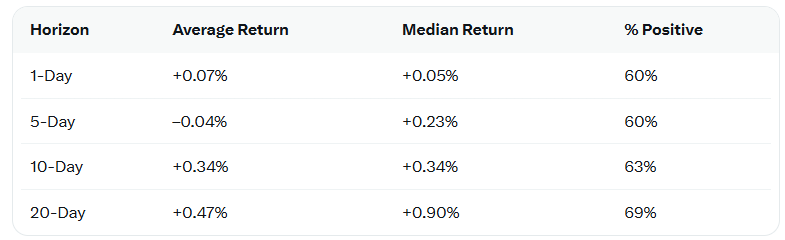
This is a reasonably rare setup, as historical scans of the SPX using its ETF proxy, SPY, since the early 2000s by GROK and CHATGPT reveal there have been 62 completed instances of this exact combination (open + close above the upper BB and RSI(5) > 75). In the completed cases, the index showed mild returns at best over the subsequent 1- to 20-day periods, consistent with short-term mean reversion after an extreme stretch. See Table 1 below.

Breadth Adds Another Layer of Caution
Supporting the technical caution is the SP500’s McClellan Oscillator (Ratio-Adjusted). See Figure 2 below. The indicator did not reach the deep oversold levels, i.e., below at least -80, two weeks ago or in May that have historically marked lasting market bottoms: below at least -80; preferably -100. Instead, it is currently at neutral levels—as seen in early 2026 (black boxes).
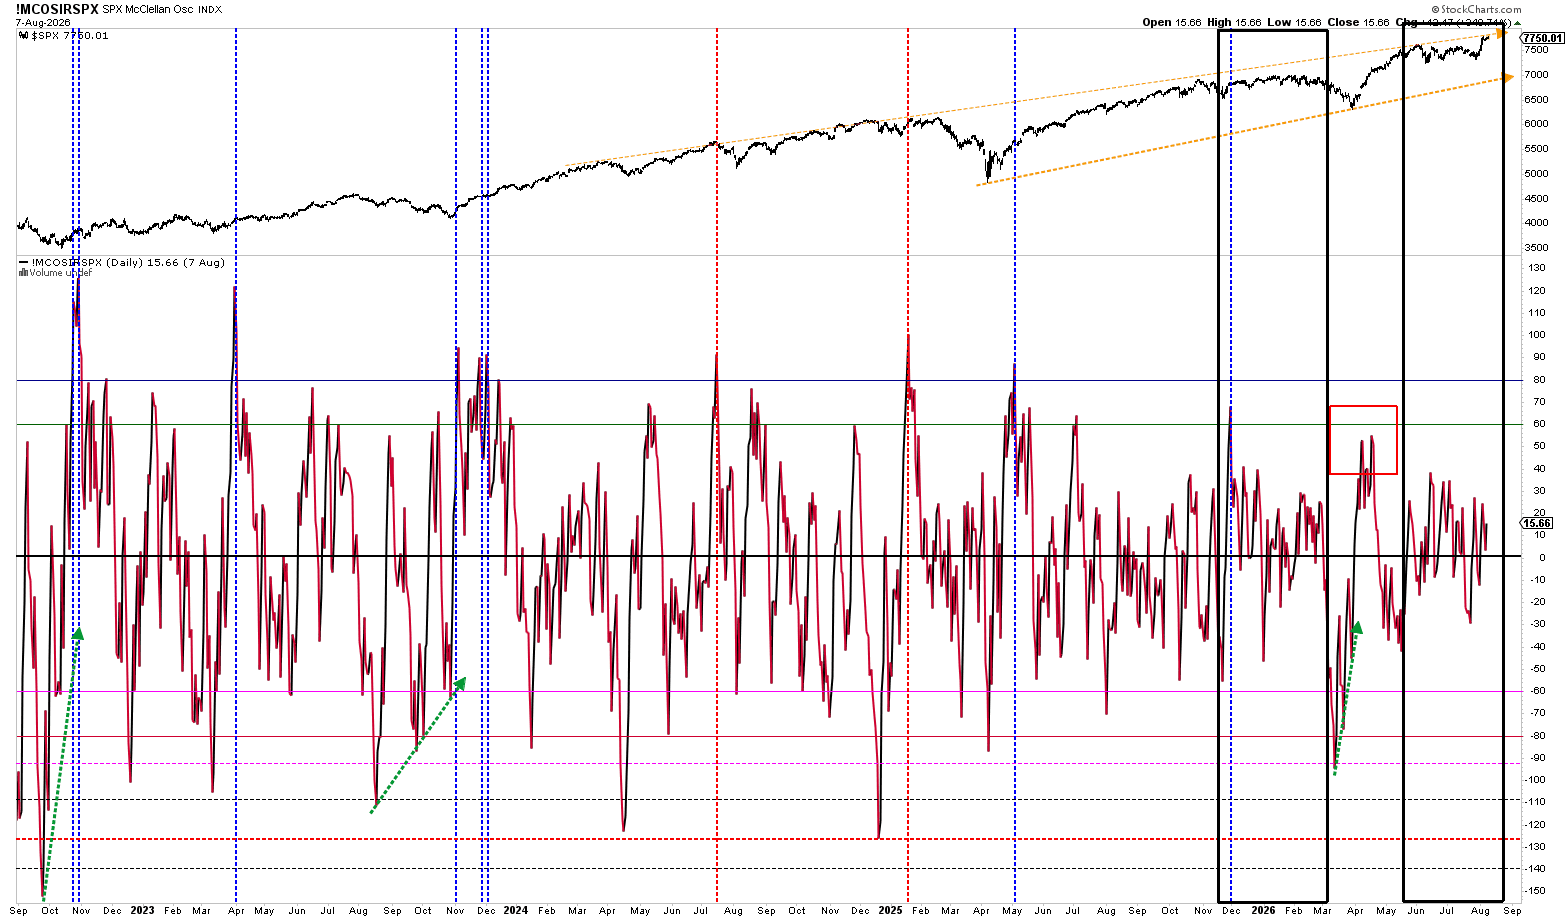
Those earlier neutral periods coincided with advances that ultimately stalled for lack of broad participation. The same dynamic appears to be unfolding now: price strength in the SPX is occurring without the kind of widespread buying that typically sustains a durable rally.
The SPX McClellan Oscillator indicates that the advance is occurring without the broad, vigorous participation that typically sustains new legs higher. The August 5 extreme Bollinger Band reading on SPX adds a short-term overbought warning, but flat internals are the more important longer-term caution. This combination historically favors a pause, consolidation, or mild pullback rather than an immediate, powerful continuation.
Adding the Elliott Wave
The most straightforward reading of the EWP count for the SPX is that it remains within a strong B-wave bounce, or possibly the latter stages of a five-wave rally (not shown) from the April 2026 low. The recent extreme Bollinger Band reading and a flat McClellan Oscillator are consistent with a maturing third wave that is becoming overextended — setting the stage for a wave-4 correction in the near-to-medium term before a final wave 5 higher.
S&P 500 Price Forecast
Every new S&P 500 analysis as it publishes, today's technical signal and key levels, live price — on one page.
See all S&P 500 forecastsA move by the SPX McClellan Oscillator back toward deeply oversold territory would be the signal that a more durable bottom (and subsequent rally) is in place. Until then, the “flat” breadth backdrop remains a headwind.