



Ethereum (ETH) has managed to stay above $1,800 in the past few days. This is a key area that has acted as both support and resistance for the top altcoin for weeks, and that could define its course in the next few days.
In the last 24 hours alone, ETH has advanced by 1.5% after two consecutive days of losses. Market sentiment has recovered considerably compared to a few days ago, as reports indicated that inflation in the United States cooled down a bit in June.
The Crypto Fear and Greed Index currently sits at 34, meaning that investors’ attitude has swung from Extreme Fear to the closest it has gotten to “Neutral” territory since the end of May.
Net Inflows to Ethereum ETFs Turn Positive In July
Meanwhile, Ethereum-linked exchange-traded funds (ETFs) brought in positive net inflows amounting to $106 million. This indicates that investors’ interest in the top altcoin has been recovering, probably as a result of the latest price action.
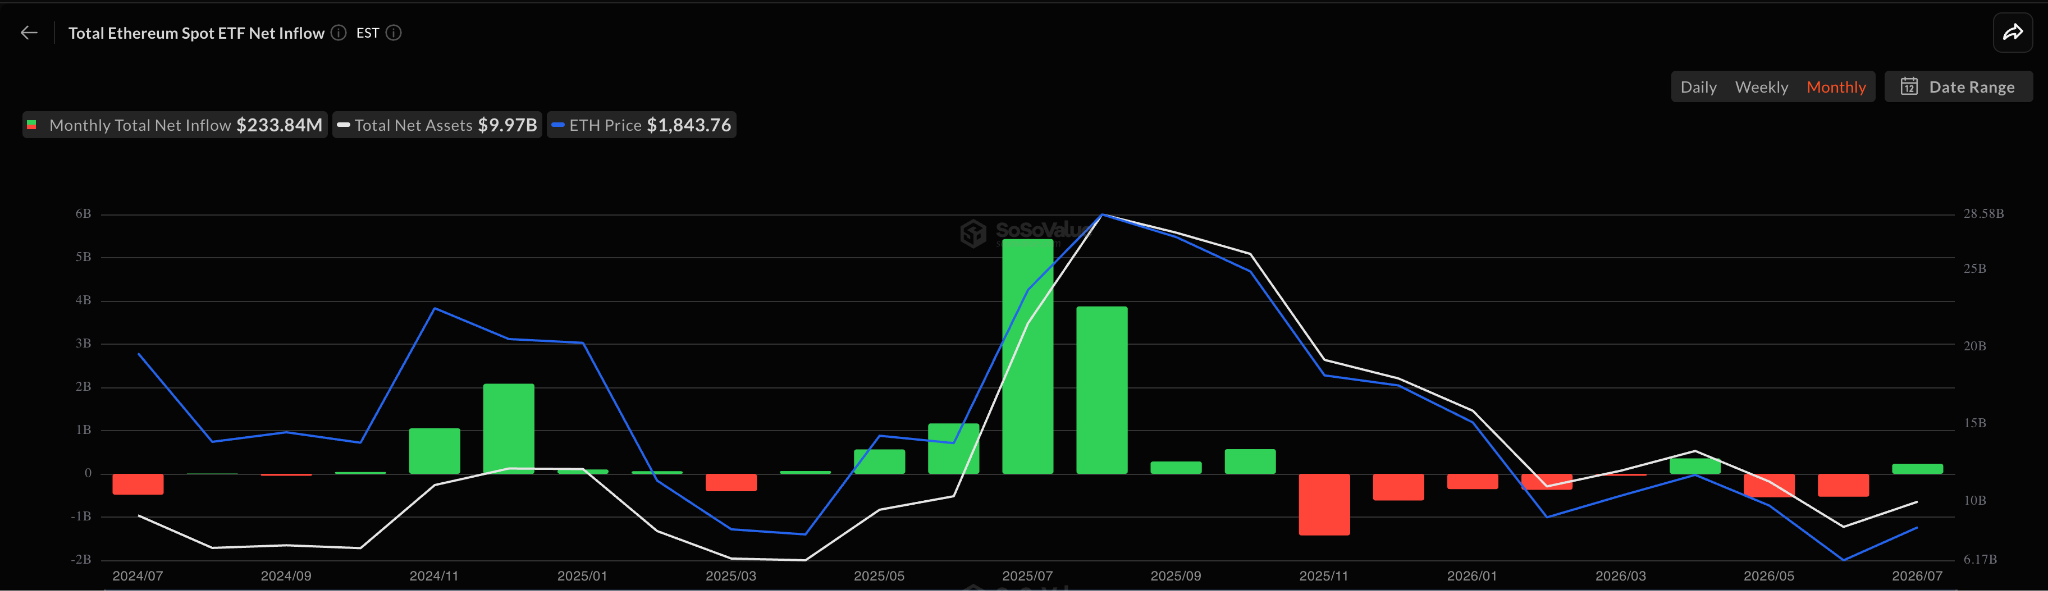
Overall, monthly net inflows in July have been positive after two consecutive months of net outflows.
However, trading volumes remain too thin to categorize this as the beginning of a true recovery for ETH at a point when other corners of the tech space like artificial intelligence (AI) and space discovery ventures like SpaceX are capturing most of the market’s attention.
Moreover, we are currently facing a negative macroeconomic backdrop defined by expectations that the Federal Reserve will raise rates at some point this year by at least 25 basis points.
This depresses sentiment and puts a tangible lid on crypto prices. For Ethereum, market conditions had prevented the token from climbing above $1,800 and could still cap its advance beyond the $2,000 psychological threshold in the next few days.
Ethereum Price Forecast
Every new Ethereum analysis as it publishes, today's technical signal and key levels, live price — on one page.
See all Ethereum forecastsThin Volumes Set the Stage for Another Failed Rally
By analyzing trading volumes, we can identify the moment in which interest in this altcoin has increased in the past and has aided its price to advance to new highs.
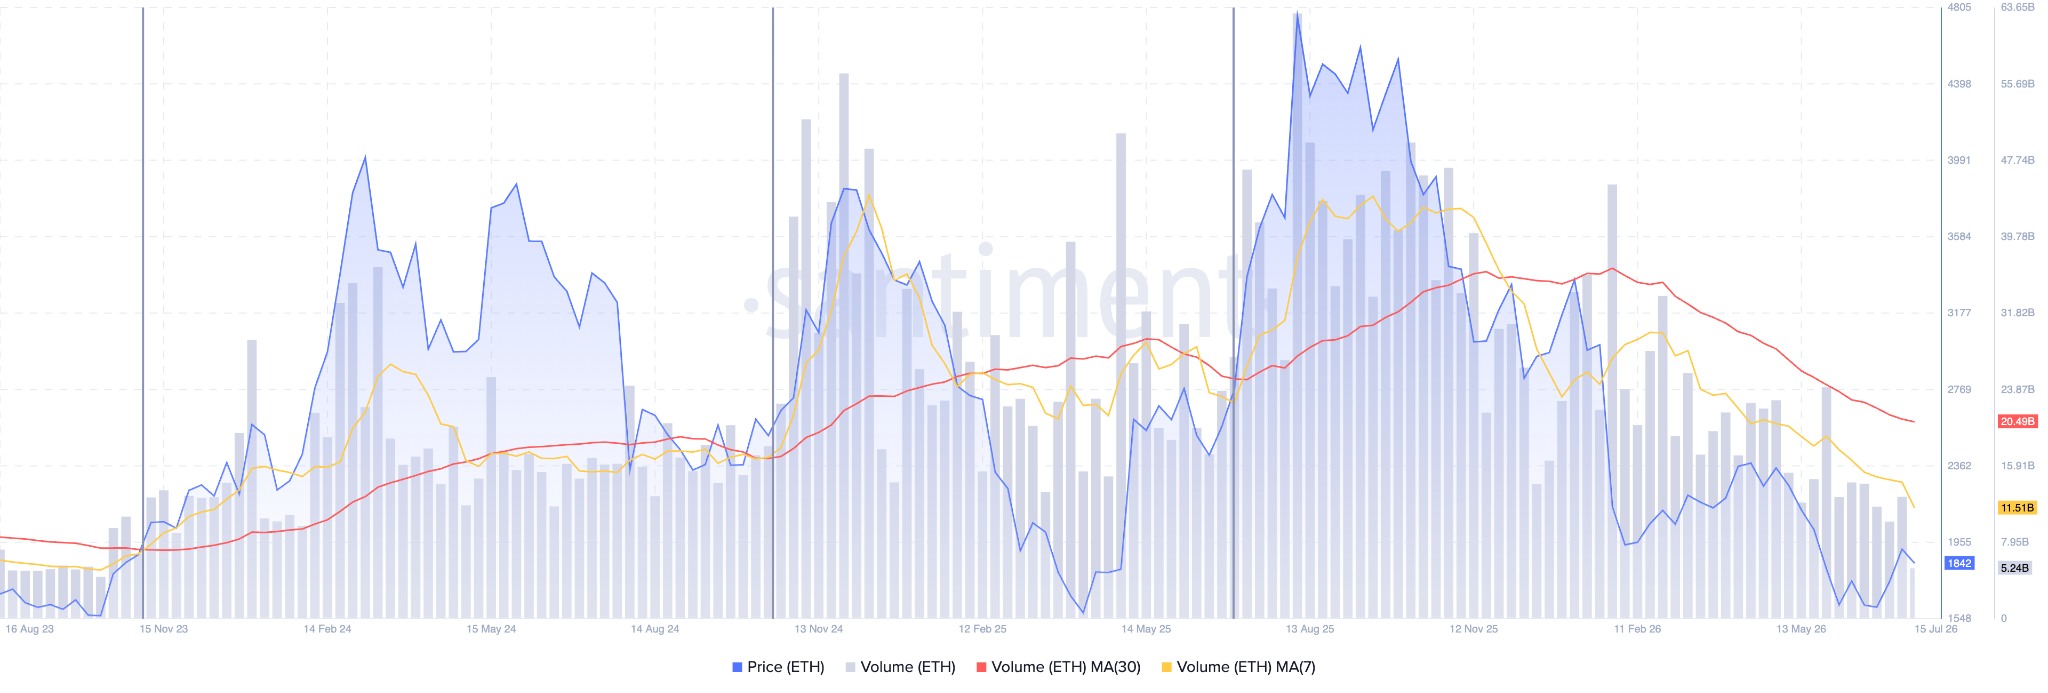
On-chain and off-chain data compiled by Santiment shows that whenever the 7-day moving average rises above the 30-day moving average for volumes, the price of ETH tends to start moving to higher levels.
Right now, the two lines are traveling in parallel. In fact, the 7-day MA is heading downwards and distancing itself even more from the 30-day MA. This indicates that interest in ETH is actually dropping, which may indicate that this will be another short-lived rally.
ETH Could Hit Another Sell Wall at $2K
Heading to the daily chart, we can see that the selling pressure started to rise after ETH hit $1,900. However, the $1.8K support is still holding up.
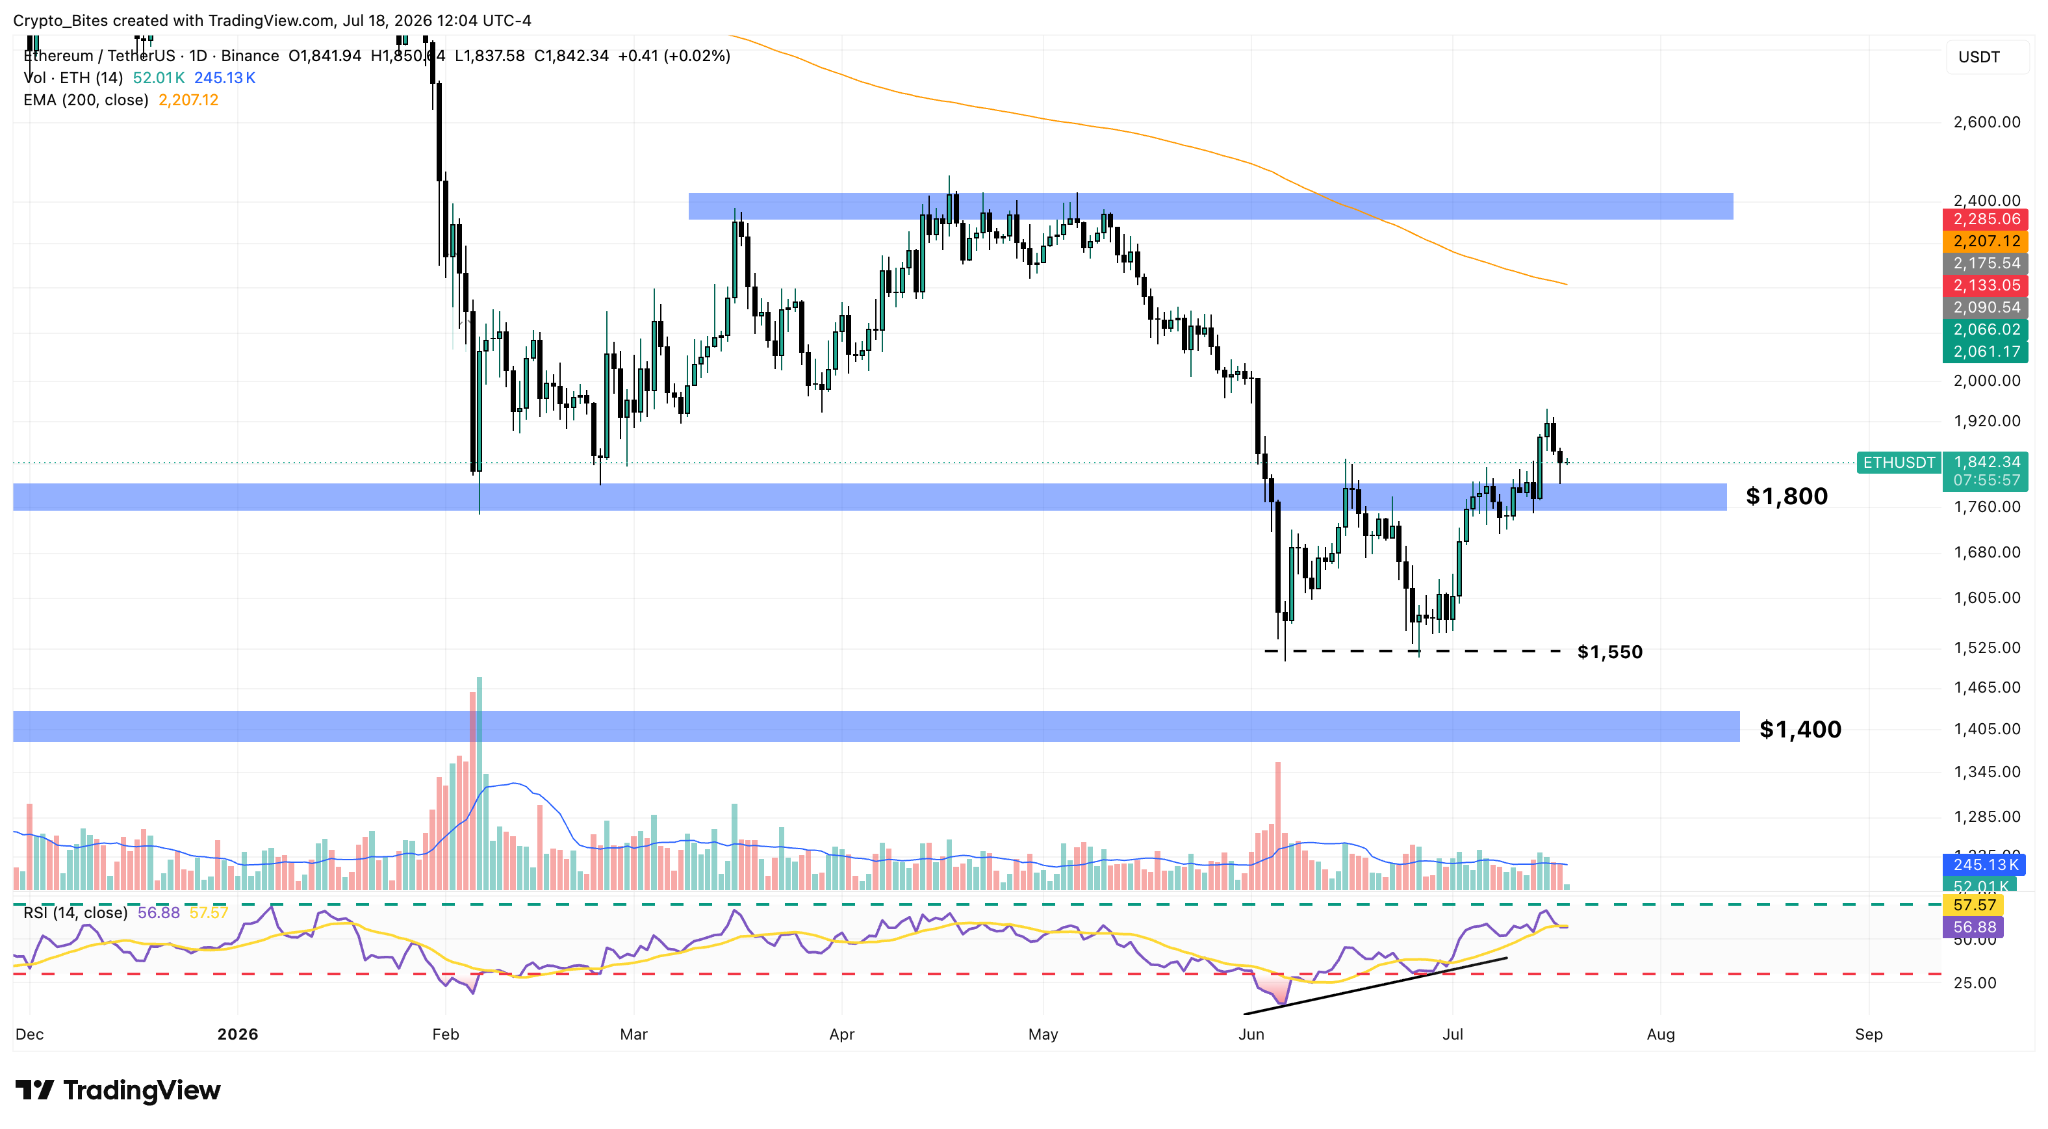
We may see the token rising to $2,000 even during this rally, but we don’t see a sustainable uptrend ahead as sentiment remains heavily depressed, the macroeconomic backdrop is still unfavorable and relatively uncertain, and volumes are too thin.
The Relative Strength Index (RSI) is still bullish as it is still sitting above 50. However, positive momentum seems to have weakened as the oscillator just dropped below the signal line.
If ETH drops below the signal line and loses the $1,800 support, that may result in the beginning of a downtrend that could push it back to the $1,550 area, meaning a 14% downside risk.