


The S&P 500 remains close to the record level as softer inflation data and strong corporate earnings improve the market sentiment. The lower CPI and PPI readings have reduced concerns about the immediate Fed rate hike. But better than expected results from major companies continue to support stocks. Rising oil prices, stronger bank credit growth and possible Fed liquidity tightening still create risks for the market. Despite these concerns, the technical outlook remains positive and is poised to gain momentum to the 8,000 level.
Inki Cho, Senior Financial Market Strategist at Exness commented:
The S&P 500 continues to reflect a balance between easing inflation pressures and resilient corporate earnings. Softer CPI and PPI data have reduced near-term Fed tightening expectations, though higher oil prices and evolving liquidity conditions could continue to weigh on sentiment. Market participants are likely to remain focused on inflation data, corporate earnings, and Fed signals.
Softer CPI and PPI Support the S&P 500 Rally
Consumer prices in the U.S. dropped significantly in June. The chart below shows that the headline and core CPI both slowed to 3.5% and 2.6%, respectively. This was due to the dramatic drop in energy prices in May and June.
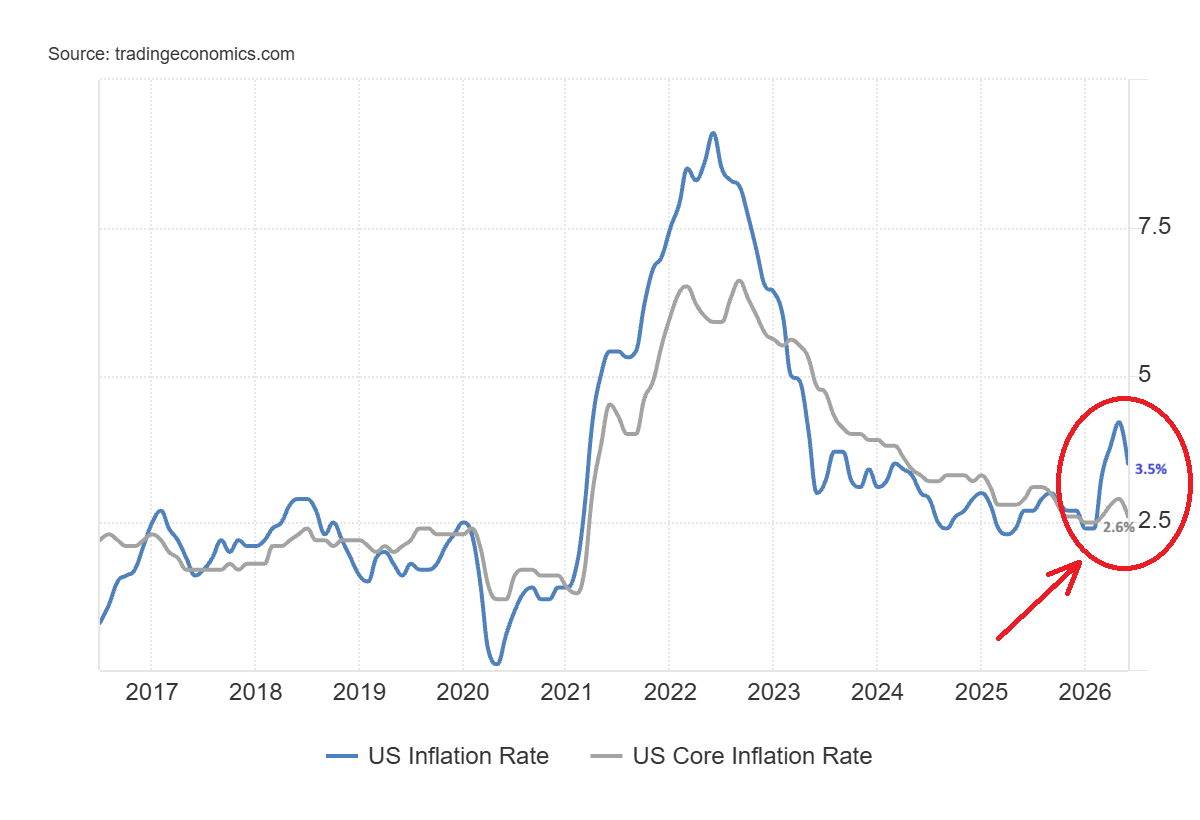
The numbers were even weaker on the monthly side and they gave investors reason to hope for a less hawkish Fed.
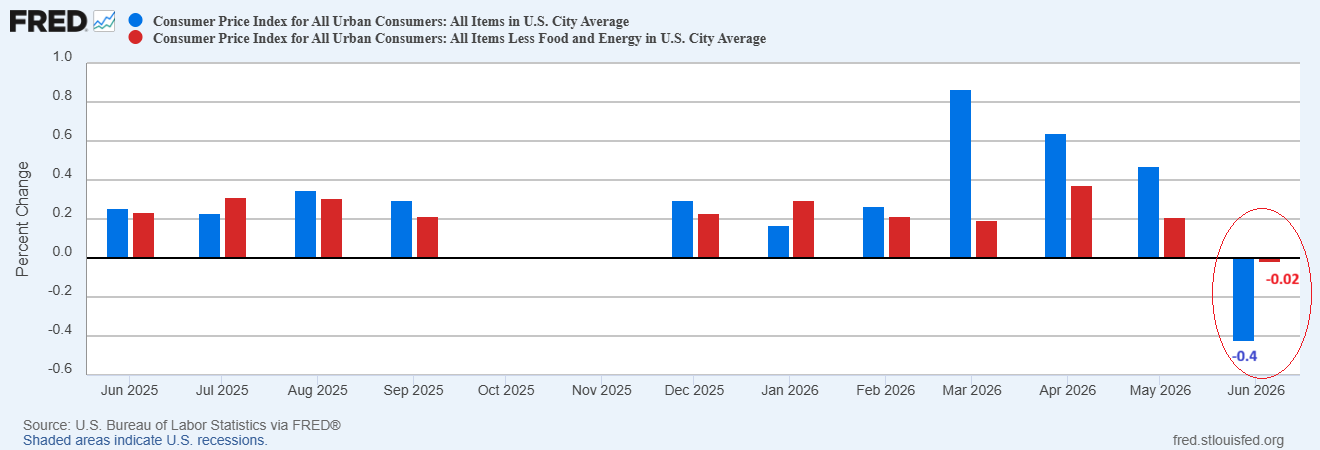
Producer prices were also lower than expected. The Producer Price Index for final demand dropped 0.3% in June.
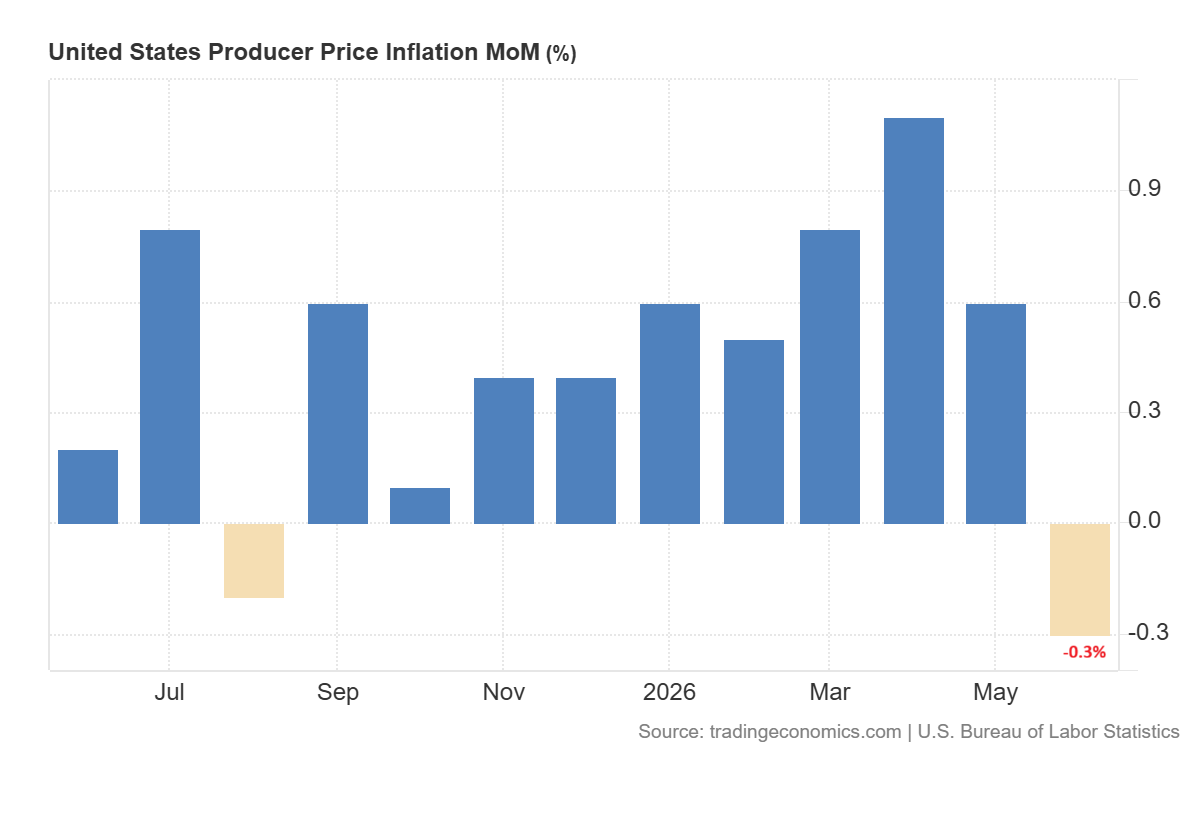
The softer CPI and PPI reports suggested that the inflation was on the back foot prior to the most recent escalation in the Middle East. This supported the US stocks as less inflation can limit the need for an interest rate hike.
But the monthly inflation data are subject to rapid fluctuations due to the volatility in energy prices. On Monday, oil prices hit the highest level in a month. The higher oil prices may cause the inflation to rise again.
The renewed tensions between the US and Iran add to this risk. A naval blockade of Iranian ports was restored and the US attacked Iranian coastal defense systems and the cruise missile storage sites. Iran also threatened to cut further energy exports to the region, which will further worsen the conflict.
But the market reaction to the latest escalation was muted as the ongoing conflict could already be baked into the price of oil. The markets focused on earnings, less inflation and a pledge by Fed Chairman Kevin Warsh to combat inflation in his second appearance before Congress. These factors supported the S&P 500 to maintain the short-term bullish structure.
S&P 500 Price Forecast
Every new S&P 500 analysis as it publishes, today's technical signal and key levels, live price — on one page.
See all S&P 500 forecastsFed Policy Risks Rise as Bank Credit Growth Fuels Inflation
The recent drop in the CPI does not necessarily take away the long-term inflation risk. Credit growth provides a better indication of price pressures rather than the month to month changes driven by energy. The chart below shows that the domestic debt grew by 5.7% in the 12 months ending March 2026 against the real GDP growth of 2.7% during the same period. The 3% gap suggests that the credit is expanding faster than the real economic output. This could add to the long-term inflationary pressure.
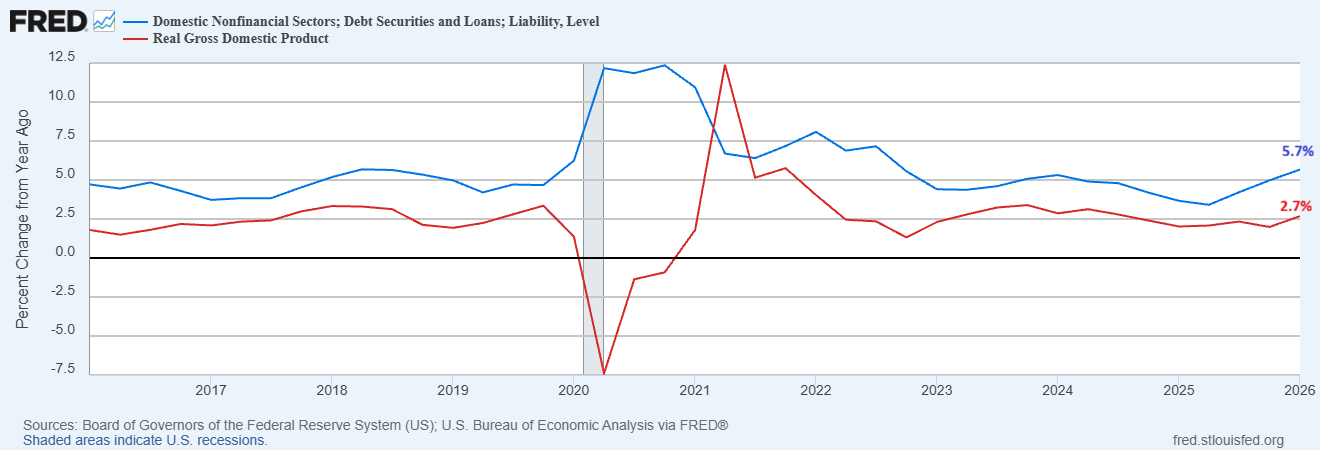
This difference might now be growing. The annual growth of bank credit increased to 7.4% in the 12 months to June. The inflation gap may potentially be 4.7% in Q2 if economic output does not increase at the same rate. This would indicate that there are inflationary forces developing under the slower CPI and PPI readings. The trend remains strong despite the drop in credit growth to 7%.
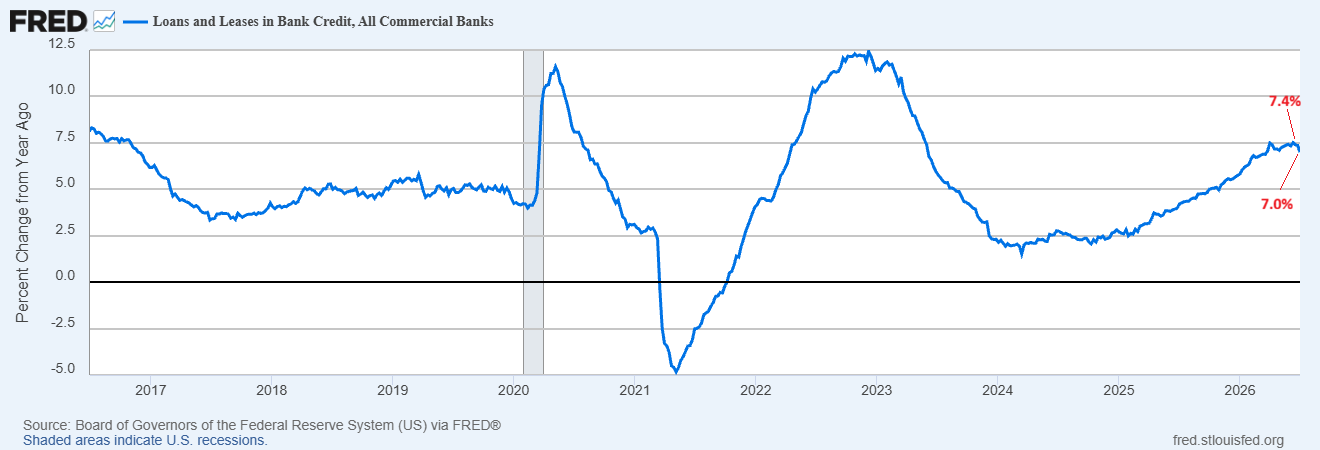
Financial markets have been expecting that the Fed would increase interest rates to address this pressure. Kevin Warsh has a hawkish policy record but an early rate hike during its first meeting may increase political and financial risks. This means he could leave the federal funds target range unchanged at 3.5% to 3.75% and find other methods to put the brakes on the credit growth.
The simplest way would be for the Fed to cut back on its holdings of Treasury securities. The central bank has added about $200 billion to its balance sheet since December last year as seen in the chart below.
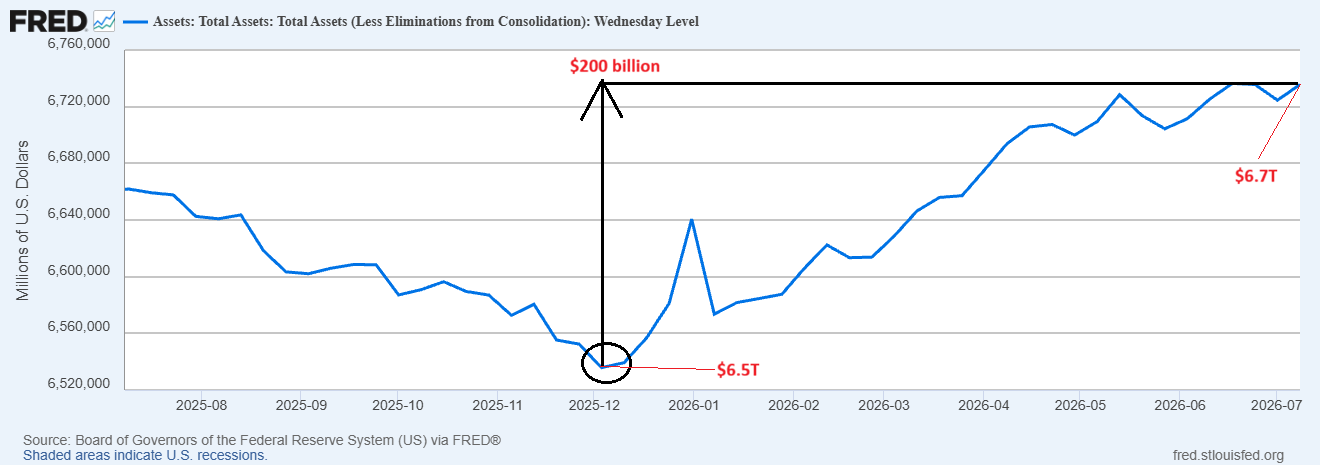
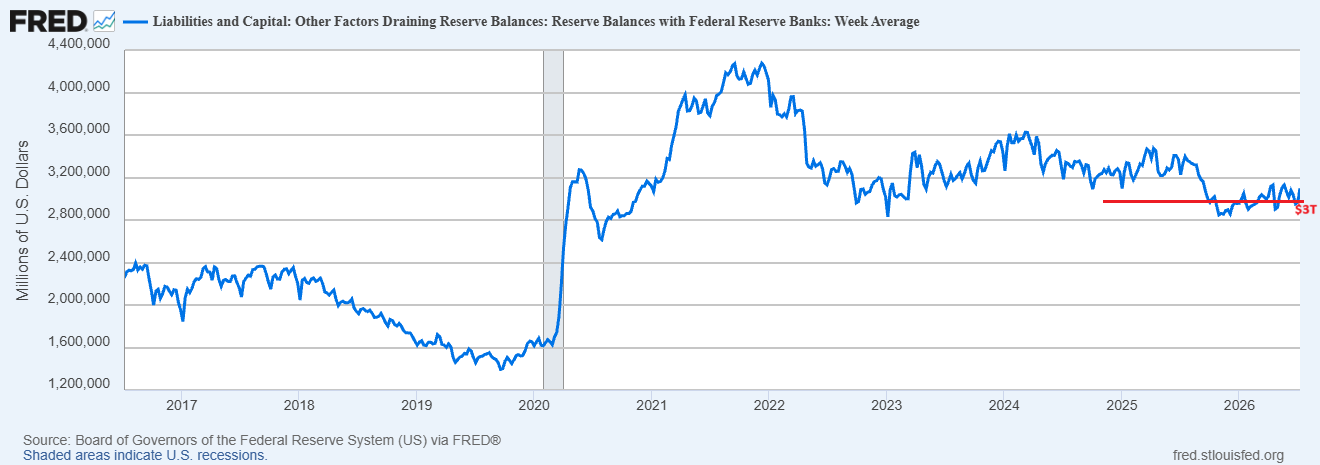
A turnaround in that growth would result in contraction of liquidity and could bring commercial bank reserves down to $3.0 trillion. This would be a way of squeezing the money market without an official rate hike. But this could lead to volatility in stocks, bonds and the repo market.
Strong Corporate Earnings Support the S&P 500 Rally
The market is currently absorbing these macroeconomic risks with the support of corporate earnings. Both BlackRock and Morgan Stanley beat quarterly profit estimates. BlackRock shares rose by over 6.5% and Morgan Stanley also rose. Morgan Stanley posted higher profits in the second quarter due to a rising number of mergers and acquisitions. BlackRock benefitted from the elevated value of its clients’ assets caused by the stock market rally. Johnson & Johnson even exceeded analyst estimates for sales and profit.
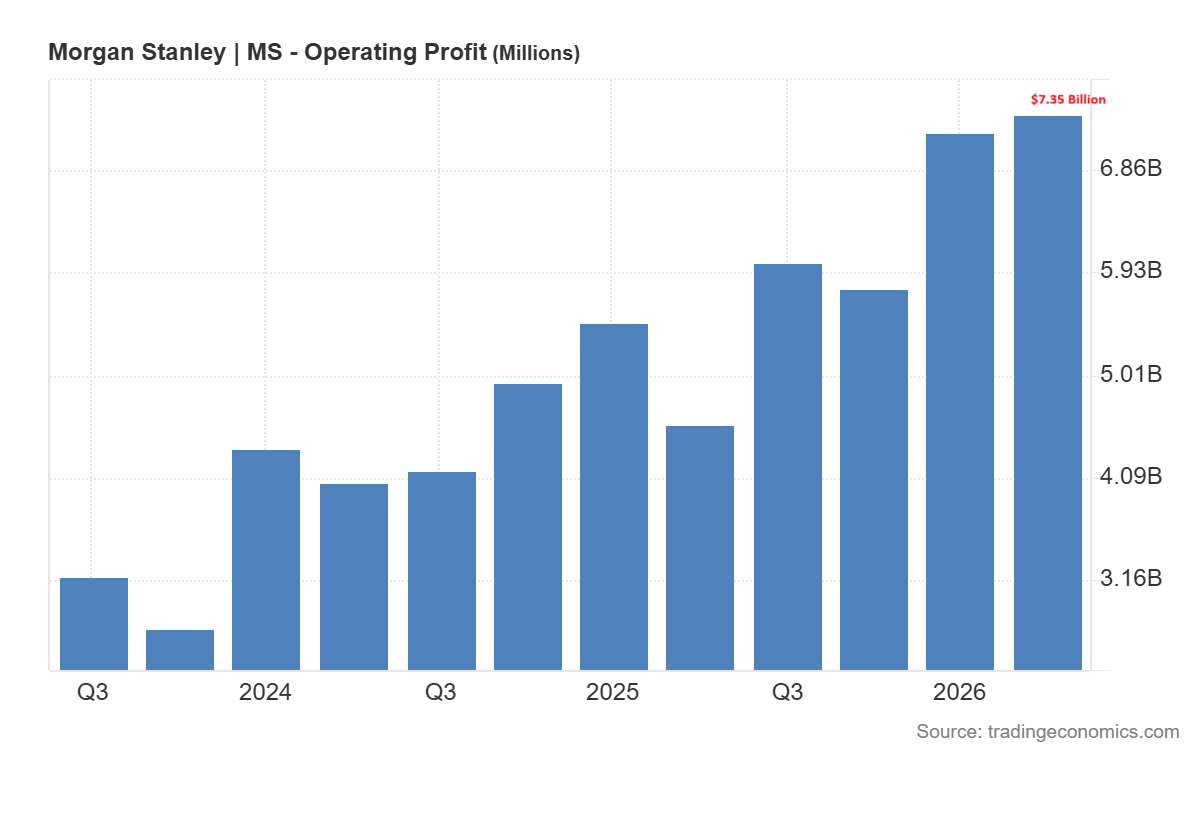
These earnings continued a good start to the earnings season following solid results from a number of Wall Street banks on Tuesday. Investors now expect earnings growth to support elevated equity prices. The Nasdaq Composite consolidated at elevated levels at around 26,309. The Dow Jones Industrial Average gained 0.2% on Wednesday to reach the 52,780 level. The broader bullish structure of the S&P 500 was also intact as the index finished higher at 7,572.
The near-term prospects for the S&P 500 are positive as long as inflation data remains soft and earnings continue to come in better than expected. But investors should not overlook the rate of bank credit growth, the prospect of another energy inflation and the Fed’s liquidity tightening.
Stocks could eventually enter into inflation driven bubbles if the Fed keeps its rates below the rate of inflation to support the Treasury market. These moves could produce large gains but they could also cause regular speculative blow-offs. The timing will be very important.
S&P 500 Forecast Targets 8,000 After Bullish Breakout
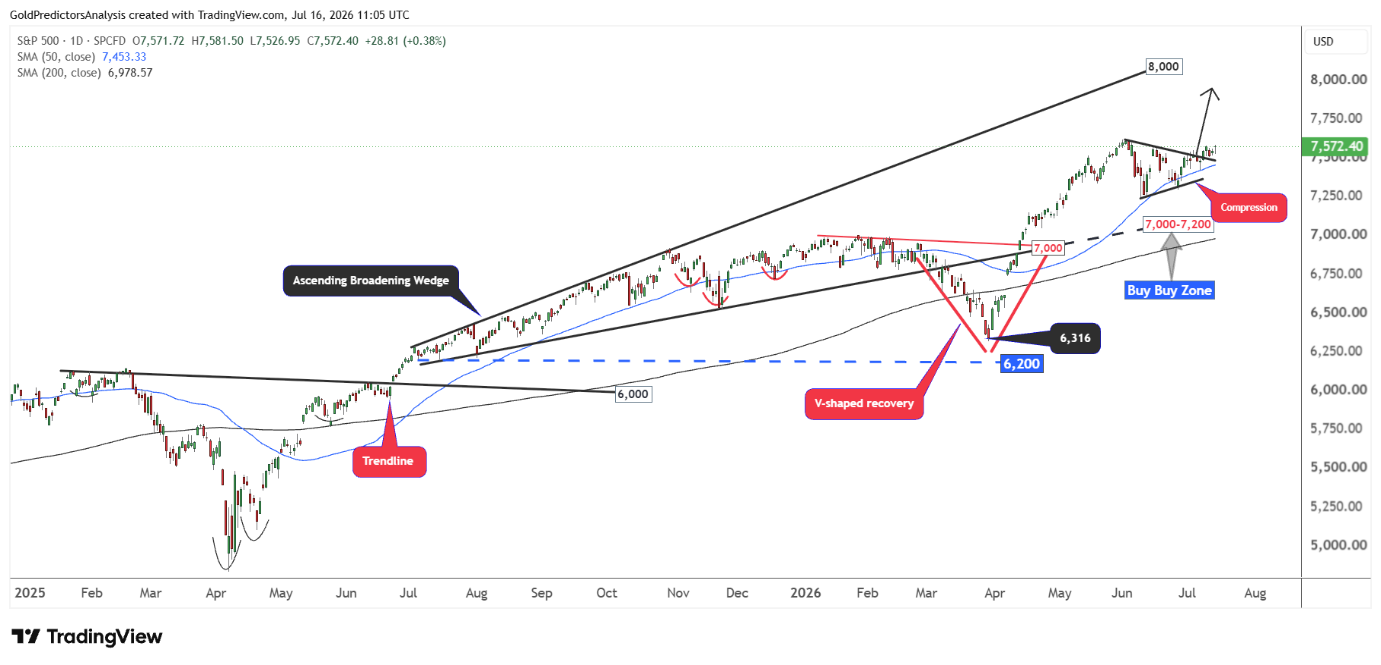
The daily chart for the S&P 500 shows that the price has produced constructive price action since the 2025 lows. The V-shaped recovery in April 2025, followed by the breakout above the 6,000 level and then consolidation within the ascending broadening wedge pattern, indicates increasing volatility in the S&P 500 market.
The market again posted a V-shaped recovery in April 2026 and broke above the 7,000 level. After surging above the 7,000 area, the index again formed a bullish pennant, which indicates price compression.
The index has also broken above 7,500, which was the resistance of this pennant. This indicates a strong move toward the 8,000 level, which is defined by the resistance of the ascending broadening wedge pattern.
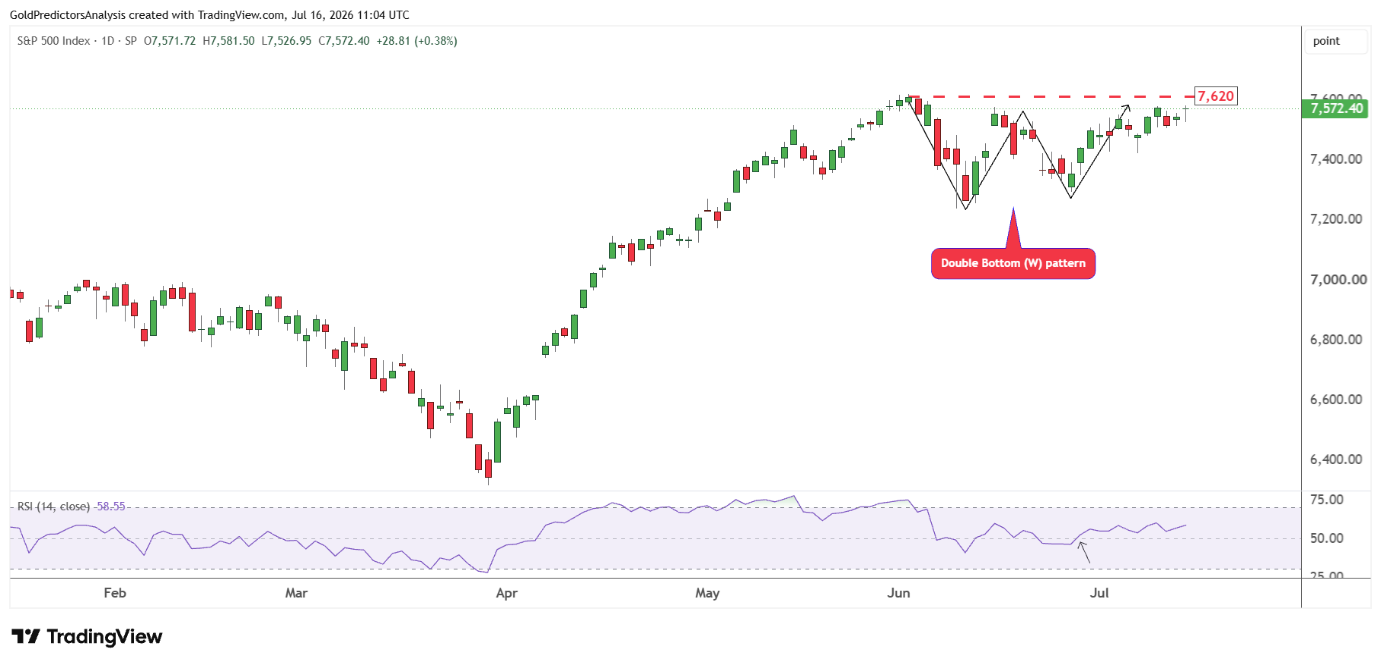
The short-term price action shows strong consolidation in July 2026 at the resistance of 7,620. The correction in June produced a double bottom, which is also termed a W pattern. This pattern is highly bullish price action. Therefore, a break above the neckline of 7,620 will trigger a strong surge in the S&P 500 toward the target of 8,000. This target is further supported by the RSI as it remains above the midline and continues to trend higher. This supports further upside in the short term.
Bottom Line
The S&P 500 outlook remains bullish as the softer inflation data and strong earnings support the market confidence. But the drop in inflation may be temporary as the faster bank credit growth, higher oil prices and renewed tensions in the Middle East may lift the inflation again. The Fed may avoid the early rate hike but it could still tighten the financial conditions by reducing the balance sheet and restricting market liquidity. These macro risks may increase the market volatility even if the S&P 500 continues higher.
From technical perspective, the index has produced price compression at the resistance by consolidating between 7,250 and 7,620. Once it has broken above 7,620, it will pave the way for a rally to 8,000. The RSI indicates bullish momentum in the short term as it consolidates above the midline on the daily chart. As long as the 7,000 level is not breached in the S&P 500, the index will likely continue to rally.