
Advertisement
Advertisement
EUR/USD Mid-Session Technical Analysis for August 31, 2015
By:
Daily EUR/USD Technical Analysis The EUR/USD is trading slightly higher at the mid-session. There was no follow-through to the downside, following
Daily EUR/USD Technical Analysis
The EUR/USD is trading slightly higher at the mid-session. There was no follow-through to the downside, following Friday’s weak close.
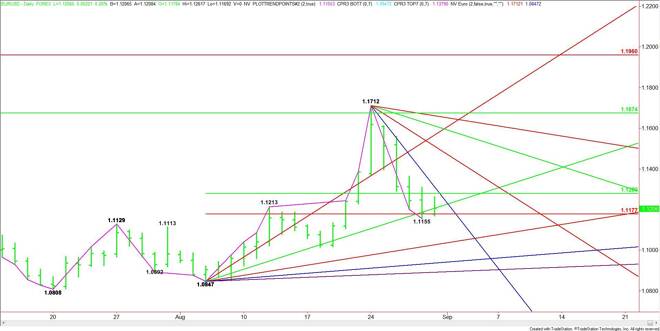
Based on the current price at 1.1204, the first support is a Fibonacci level at 1.1177. This is followed by Friday’s low at 1.1155. The direction of the market into the close will be determined by trader reaction to the Fibonacci level.
A sustained move over the Fibonacci level at 1.1177 will signal the presence of buyers, but don’t expect an acceleration to the upside unless buyers can sustain a rally above an uptrending angle at 1.1207.
Holding above 1.1207 could trigger a rally into the 50% level at 1.1280. This is followed closely by a steep downtrending angle at 1.1312. This is a potential trigger point for an upside breakout.
Look for a bearish tone to develop under 1.1177. The daily chart opens up to the downside under this level. The next potential downside target is another angle at 1.1027 today.
Watch the price action and read the order flow at 1.1177 today. This will tell us whether the bulls or the bears are in control.
2-Hour EUR/USD Technical Analysis
The main trend is down according to the 2-Hour swing chart. The short-term range is 1.1155 to 1.1262. Its 50% level or pivot at 1.1208 is currently being tested. Trader reaction to this pivot could determine the direction of the EUR/USD on the 2-Hour chart.
A sustained move over 1.1208 will signal the presence of buyers. This could trigger a rally into 1.1262. A trade through this level will turn the main trend to up on the 2-Hour swing chart.
Taking out 1.1262 will likely lead to a test of the major Fib level at 1.1283. This is followed by another main top at 1.1309.
A sustained move under 1.1208 will signal the presence of sellers. This could lead to a steep drop into the last main bottom at 1.1155.
If you are following the 2-Hour chart then trader reaction to 1.1208 will determine the direction of the market the rest of the session. If it breaks then watch the reaction at 1.1177 since this is a key number on the daily chart.
About the Author
James Hyerczykauthor
James Hyerczyk is a U.S. based seasoned technical analyst and educator with over 40 years of experience in market analysis and trading, specializing in chart patterns and price movement. He is the author of two books on technical analysis and has a background in both futures and stock markets.


Advertisement