The FTSE 100 went slightly higher during the day on Tuesday, testing the 7400 level. However, we did find a bit of resistance there is one would
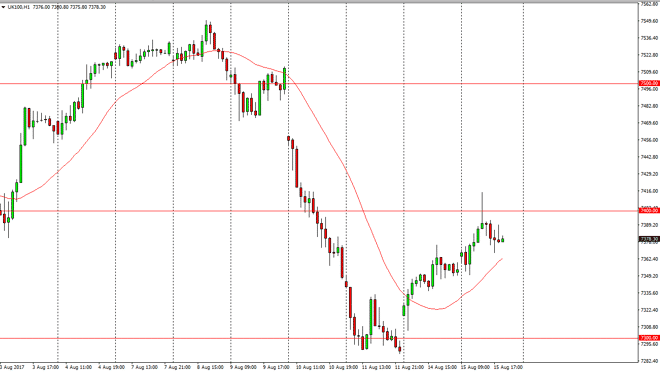
The FTSE 100 went slightly higher during the day on Tuesday, testing the 7400 level. However, we did find a bit of resistance there is one would anticipate due to the large, round, psychologically significant number. When I look at the chart, the hourly shooting star is a good signal to start buying if we can break above the candle, which should send this market higher to fill the gap above, which is centered around the 7500 level. A break above the top of the shooting star is very bullish in my estimation, so I would not hesitate to buy that trade. Alternately, we have a gap below that could be filled, so if we break down below the 7350 handle, I would be a seller. Either way, I look at this is a market that is going to show a significant amount of volatility, so be careful and keep your position size small.
Chris is a proprietary trader with more than 20 years of experience across various markets, including currencies, indices and commodities. As a senior analyst at FXEmpire since the website’s early days, he offers readers advanced market perspectives to navigate today’s financial landscape with confidence.