Testing Major Support
Gold continued its bearish correction during Wednesday’s session, dropping to a new pullback low of $4,401 and testing a key support zone. The confluence of the 61.8% Fibonacci retracement at $4,397 and the 200-day moving average around $4,395 was tested as support, resulting in an intraday bounce that led to a recovery above two trendlines.
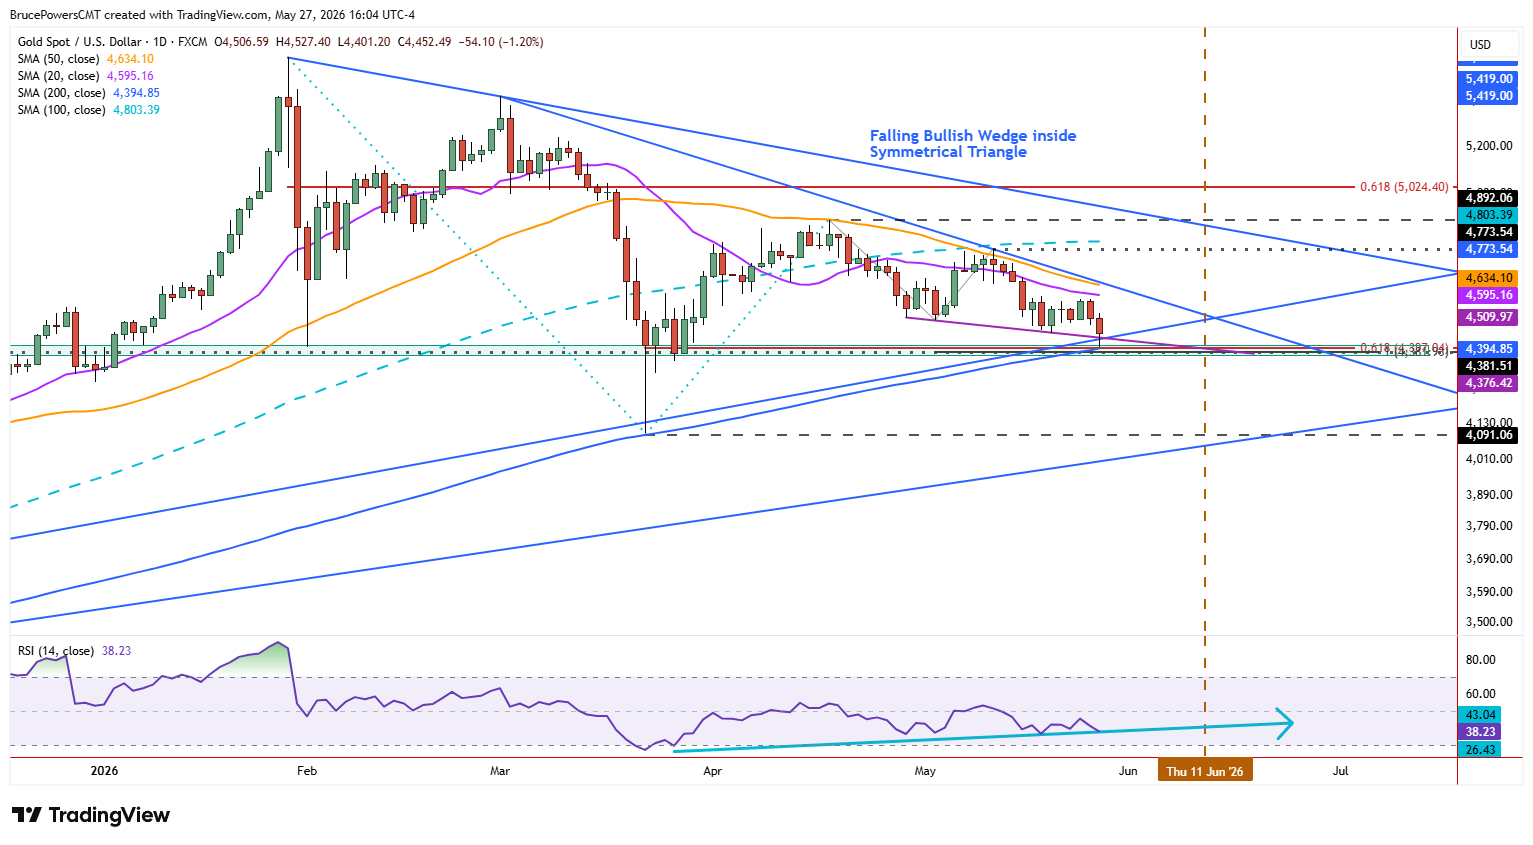
During the decline, gold broke below potential support near the lower boundary line of a falling wedge pattern and an uptrend line that connects to the March swing low. Following signs of support earlier in the session, gold recovered both lines and is on track to close above them, signaling that buyers may be responding aggressively near a key technical inflection point.

Buyers Respond Near 200-Day Average
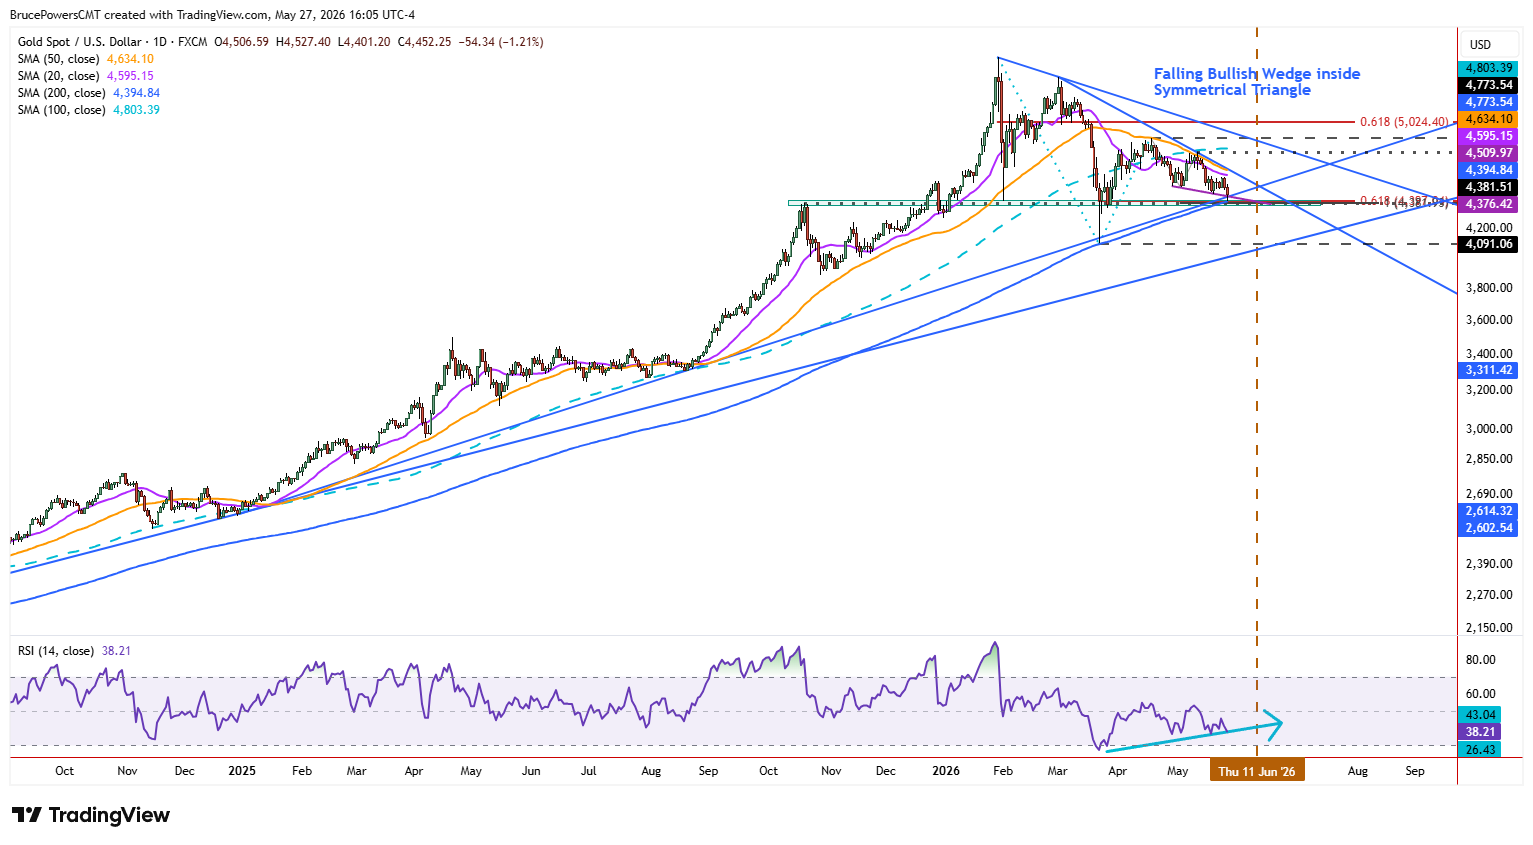
Given the confluence of indicators near the 200-day moving average that point to likely strong support, and the bullish response once reached, the bearish correction may be close to completion. The 200-day moving average was previously confirmed as dynamic trend support during the sharp decline in March. That behavior showed that, despite elevated volatility, buyers recognized the area around the average as a key support zone. The expectation is that buyers could once again get more aggressive if the support zone holds.
Reversal Signals Begin to Improve
The first signs of strength would appear on a rally above Wednesday’s high of $4,527, but that would initially represent only a bounce within the current bearish trend structure. Tuesday’s slightly lower swing high of $4,580 is part of the bearish trend structure, so a recovery of that level will provide a bullish reversal signal for the near-term trend structure. Also, the 20-day moving average is nearby around $4,595.
Nonetheless, a downtrend line marks dynamic resistance for the downtrend, and it also defines the upper boundary of a potential falling bullish wedge pattern. The 50-day moving average, now near $4,634, aligns closely with the trendline and therefore can be used as a proxy for the line. If the 20-day moving average is reclaimed the possibility of reclaiming the 50-day average improves, which would trigger a breakout of the wedge.
Resistance Zone Becomes Key Test
Following such a breakout, the next target zone is the confluence of the lower swing high of $4,774 from May and the 100-day moving average, now near $4,803. Both the 50-day and 100-day moving averages were recognized as a resistance zone during the prior upswing, with the 50-day moving average also acting as resistance in April. Therefore, resistance can be anticipated again, but a decisive breakout above that zone would provide further evidence that the bullish response from support near the 200-day moving average marked the beginning of a broader recovery attempt.
Gold Price Forecast
Every new Gold analysis as it publishes, today's technical signal and key levels, live price — on one page.
See all Gold forecastsIf you’d like to know more about how to trade gold and silver, please visit our educational area.