Bearish Exhaustion Signals Emerging at Key Support
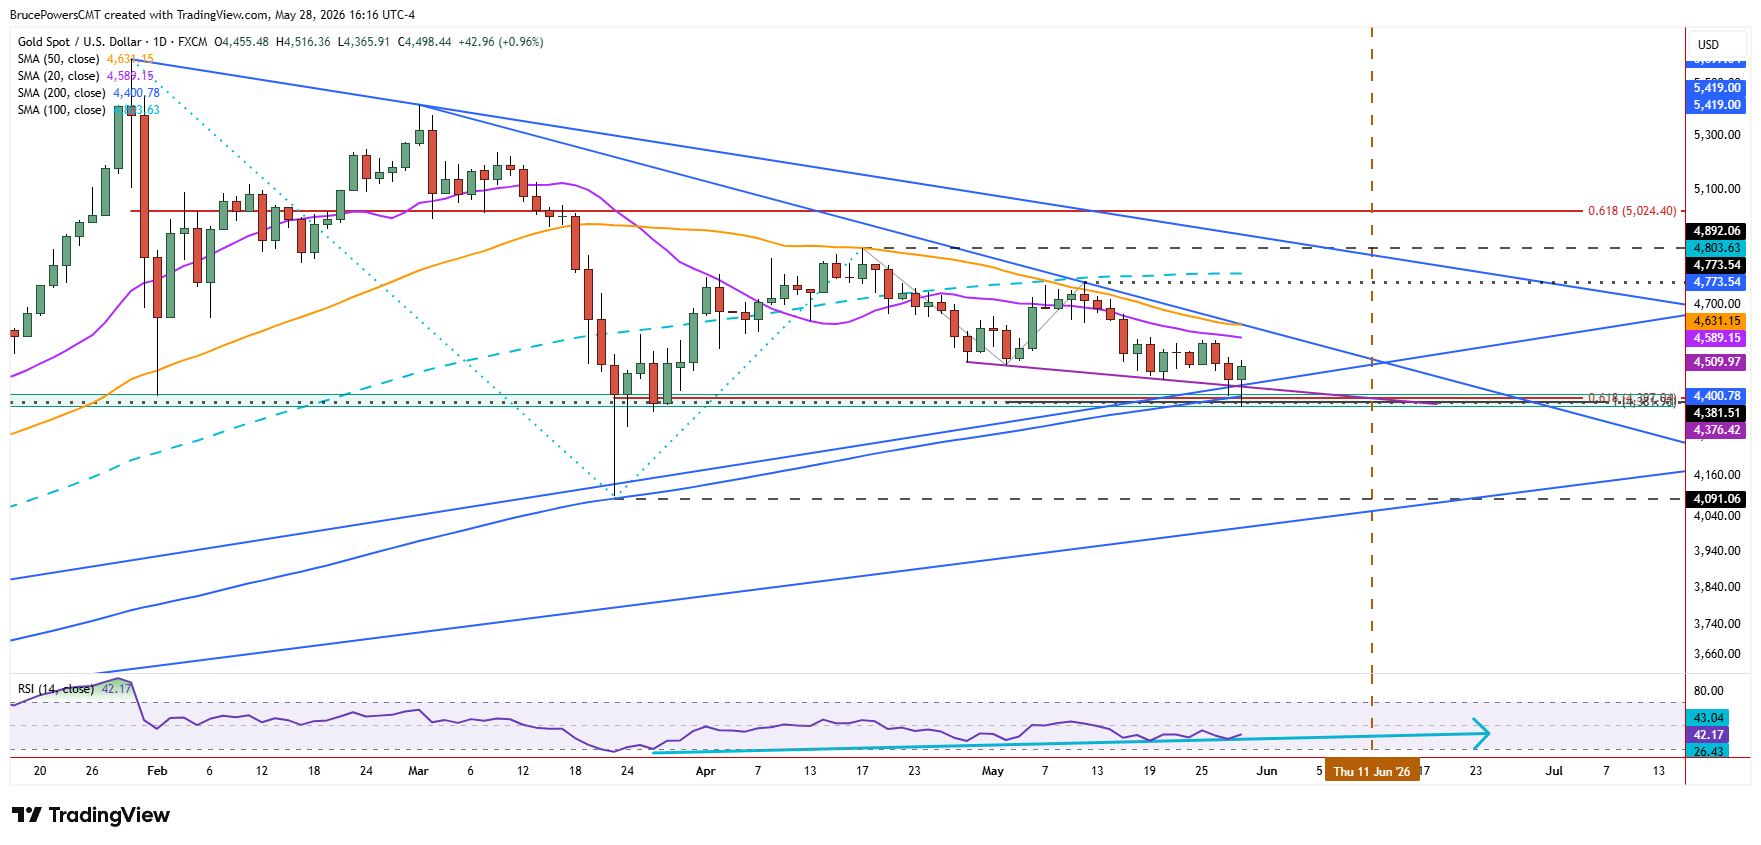
It is starting to look like gold may have reached a bottom for the bearish correction. On Thursday, it extended its decline to a new low of $4,366, testing a support zone anchored by the 200-day moving average. Subsequently, buyers took back control after a minor undercut of the average, which is near $4,401, leading to an intraday rally and a positive close on the day. A potentially bullish hammer candlestick pattern is set to complete with a lower daily high of $4,516.

200-Day Moving Average Defines Inflection Zone
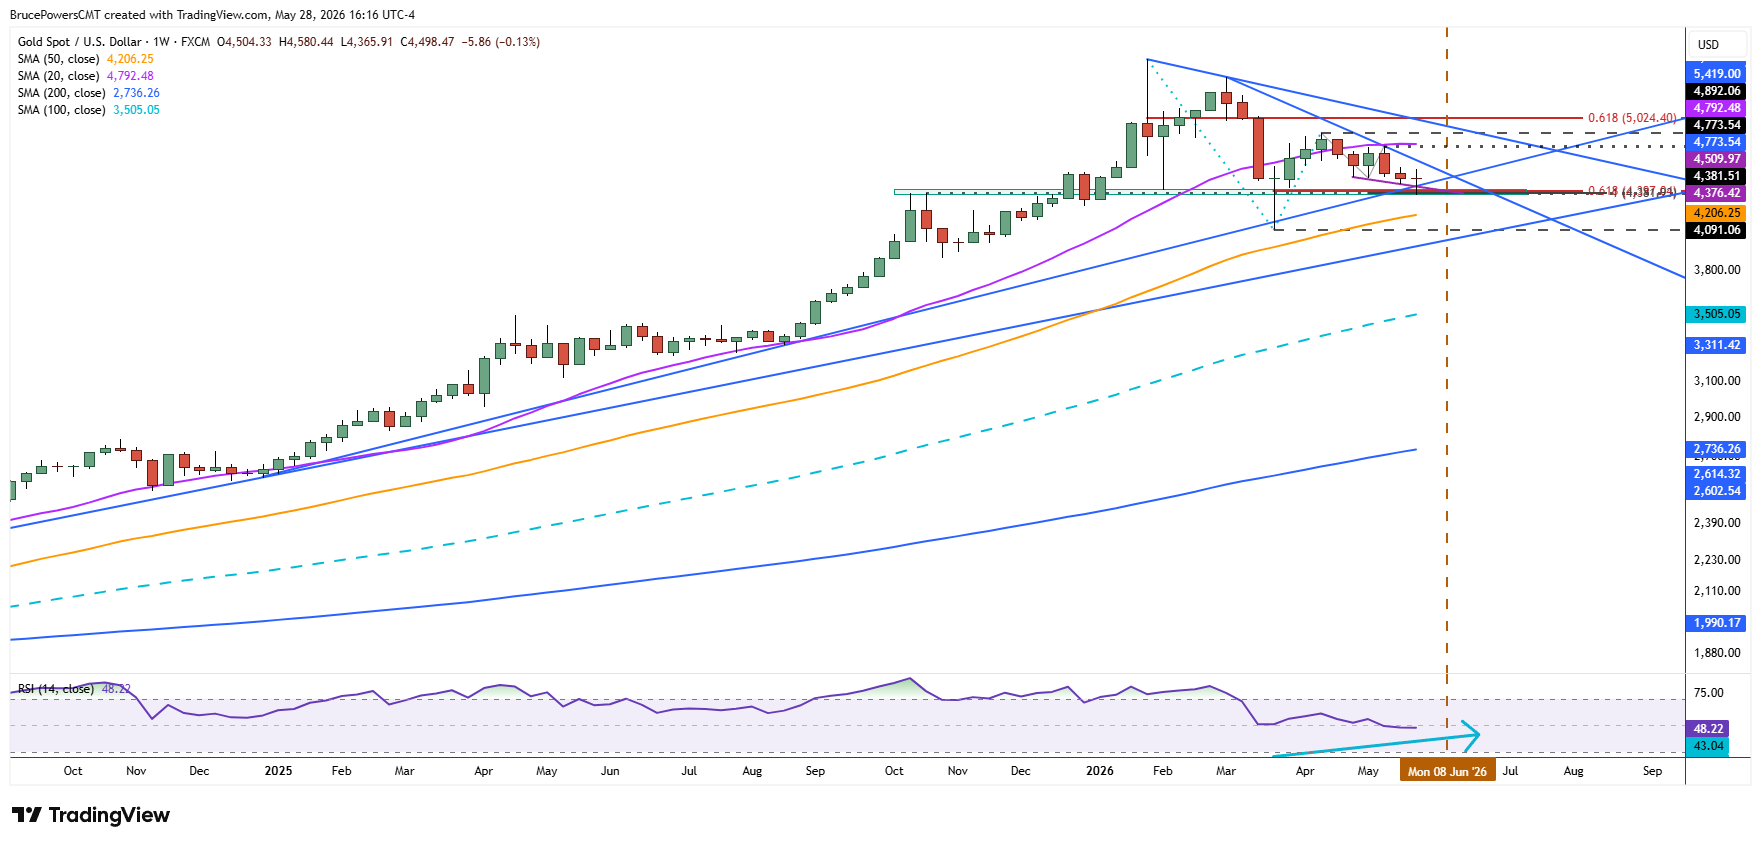
The 200-day moving average has been a lower target since it was successfully tested as support during the sharp decline in March. That was the first test of the 200-day line since February 2024. This second test, assuming it continues to hold, further establishes long-term trend support near the 200-day average and strengthens its role as a key structural pivot for gold’s broader trend.
Bottoming Structure Faces Validation Test
After two successful tests of support near the average, gold may have hit a bottom that may lead to an eventual challenge to the current record high of $5,597. However, a drop below today’s low could change that, as it would suggest a possible extension of the decline and a failure of support near the long-term trend indicator.
Resistance Confluence at trendline and 50-Day Moving Average
Key near-term resistance is a lower swing high at $4,589. A decisive advance above that level will trigger a bullish reversal of the short-term decline. Also, the 20-day moving average would be reclaimed, as it is now at $4,589 and falling. Nonetheless, the more significant next price level is indicated by the 50-day moving average.
It was successfully tested as resistance to the prior two advances. It converged with the downtrend line today, forming a key confluence resistance zone. Therefore, a bullish trend reversal signal will trigger above that average, currently near $4,631. Since the apex of a symmetrical triangle is shown around June 11, gold may trigger an upside breakout above the 50-day average before then.
Gold Price Forecast
Every new Gold analysis as it publishes, today's technical signal and key levels, live price — on one page.
See all Gold forecastsRecovery Targets Point Toward Higher-Timeframe Resistance
Following the successful reclaim of the 50-day average, gold targets a lower swing high at $4,774 and the 100-day moving average, now near $4,804. A sustained advance above the lower swing high will trigger a bullish reversal and likely continuation of the advance toward higher resistance levels not yet tested in the current corrective phase.
If you’d like to know more about how to trade gold and silver, please visit our educational area.