


Gold News: Warsh Speech Looms as Fed Inflation Warnings Intensify
Investors wait for Chair Jackson Hole today in Jackson Hole as he speaks about whether the persistence of inflation may warrant another rate hike. In July, the PCE price index showed an increase of 3.7% from last year, and several members of the Fed gathering in Jackson Hole this year said the policy may still be too accommodating. Beth Hammack and Jeffrey Schmid of the Cleveland and Kansas City Fed respectively both said inflation is still too high, showing an even higher risk of more aggressive policy.
In the futures market, investors place a potential Fed Funds rate hike in September at 33%, but the chance of a rate increase at least once by the end of this year is much higher. Currently, precious metals are highly sensitive to the speech by Chairman Warsh as increased hawkishness from the Fed may posit a high opportunity cost to holding gold and silver.
Longer term concerns are more supportive. Reuters stated in an article the continued buying of gold by funds and futures contracts and growing official sector demand would strengthen gold’s buying interest. Further, the more hawkish long-term U.S. Treasury bonds provide incentive to gold.
Diplomatic efforts to allay tensions in the Strait of Hormuz have lessened some geopolitical tensions, but Washington has announced plans to push for more international support for sanctions on Iran. Until the sanctions are passed, the safe-haven premium remains.
Silver continues to have a financial and industrial demand-related component. Over the long term, AI, semiconductor, and power grid investments will benefit silver. In the short term, elevated interest rates will be a constraint.
The most important near-term catalyst for silver for August 28 is the Jackson Hole speech by Warsh. Depending on whether Warsh addresses sticky inflation or not, expectations for higher interest rates will be either weaker or stronger, respectively. In the absence of policy direction, higher rates will support demand for defensive investments.

Gold Technical Analysis: XAU/USD Tests the 50% Fibonacci Support as Pullback Deepens
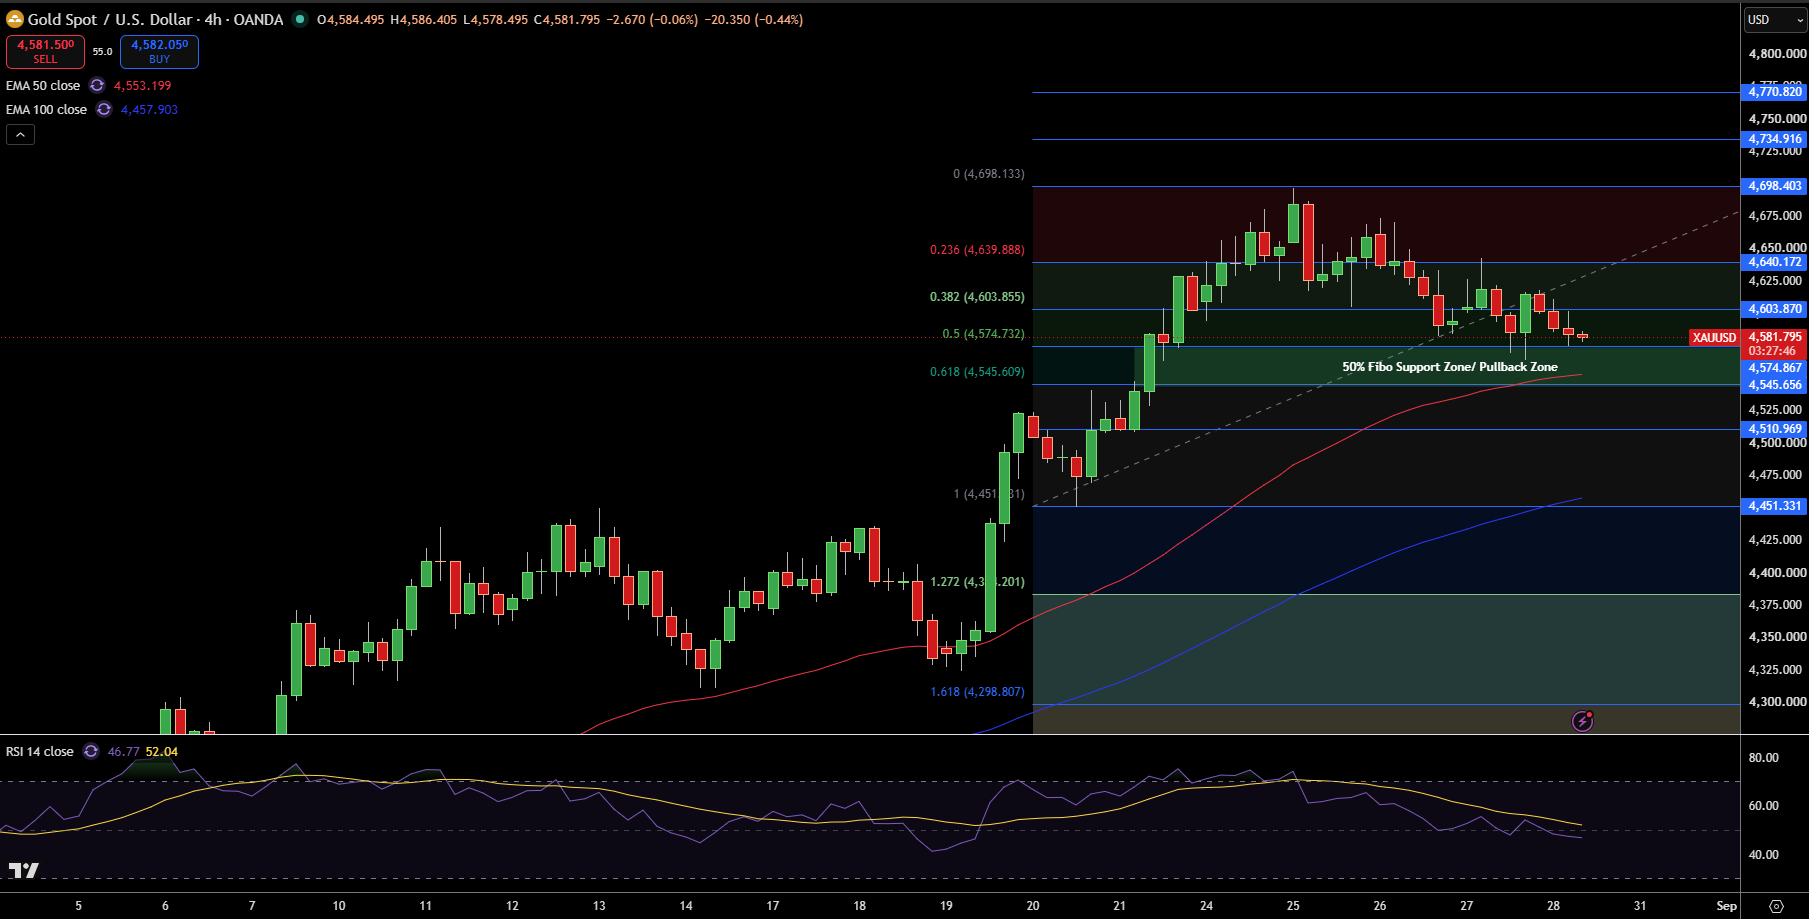
Gold price is consolidating around $4,582 after a brief correction from the resistance zone of $4,698 on the 4-hour chart. Price has broken the 38.2% Fibonacci level of $4,604 and is currently testing the 50% zone at $4,575, which is marked as the key pullback support zone on the chart. The 50 EMA is situated at $4,553 and the 100 EMA is situated at $4,458, so the trend is more bullish while short-term price momentum is weakening.
The RSI at 47 shows that price momentum is slightly in the bearish territory, but that momentum is still far from being in the oversold territory. The immediate support zone lies between $4,575 and $4,546, with additional support seen at $4,511 and $4,451. Price resistance lies at $4,604 along with $4,640, $4,698, $4,735, and $4,771.
As far as I’m concerned, the price must remain above $4,575. Support at $4,575 would encourage a rally to the resistance at $4,604. A break below $4,575 would expose price to the support at $4,546 along with $4,511 in the near future, after which buyers may take control again.
Gold Price Forecast
Every new Gold analysis as it publishes, today's technical signal and key levels, live price — on one page.
See all Gold forecastsSilver Technical Analysis: XAG/USD Remains Trapped in Consolidation Between $67.69 and $69.96
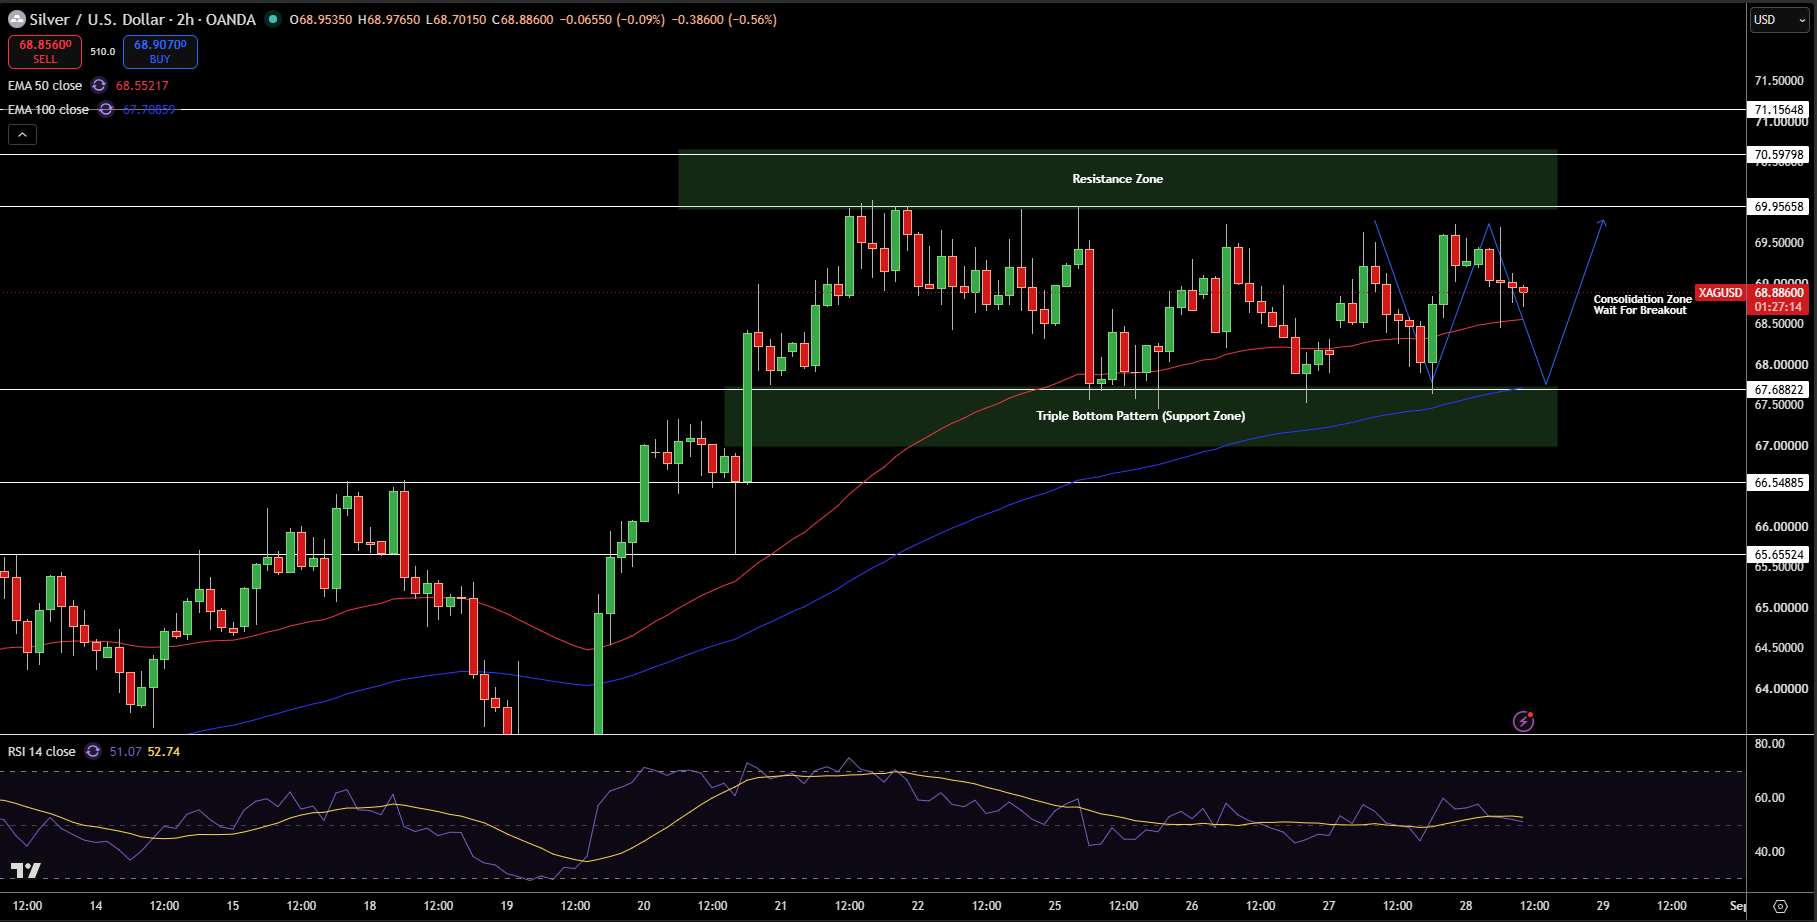
At $68.89, Silver is stuck in the same range bound consolidation structure on the 2-hour chart. Silver is currently trading above the 50 EMA (at $68.55) and the 100 EMA (at $67.71) which is keeping the short term move bullish. Silver failed to break above the upper resistance zone but has developed a strong support zone at $67.69 and higher where a triple bottom pattern has formed. The main resistance zone is at $69.96 to $70.60.
RSI at 51 indicates neutral momentum and confirms the sideways narrative. Silver faces resistance at $69.50, $69.96 then $70.60 and $71.16. On the other hand, support is at $67.69, then $66.55 and $65.66.
Silver is still in no man’s land and waiting for a breakout. As long as Silver trades above $67.69 the setup is bullish, whilst a clean break above $69.96 opens a run to $70.60 to $71.16. A break of $67.69 would be bearish and invalidate the triple bottom setup.


