Spot Gold Reverses $150 Off the Lows as GDP Misses and Ceasefire Breaks
Spot Gold (XAUUSD) opened near $4,457 Thursday morning, crashed to $4,366.23, then reversed $150 to hit $4,516.63 before settling around $4,500. That is a 1% gain on a day that started with sellers in full control. The morning low tested the 200-day moving average at $4,394.70 and held. Everything that happened after that was about two numbers and one headline.
Daily Spot Gold (XAUUSD) Technical Analysis
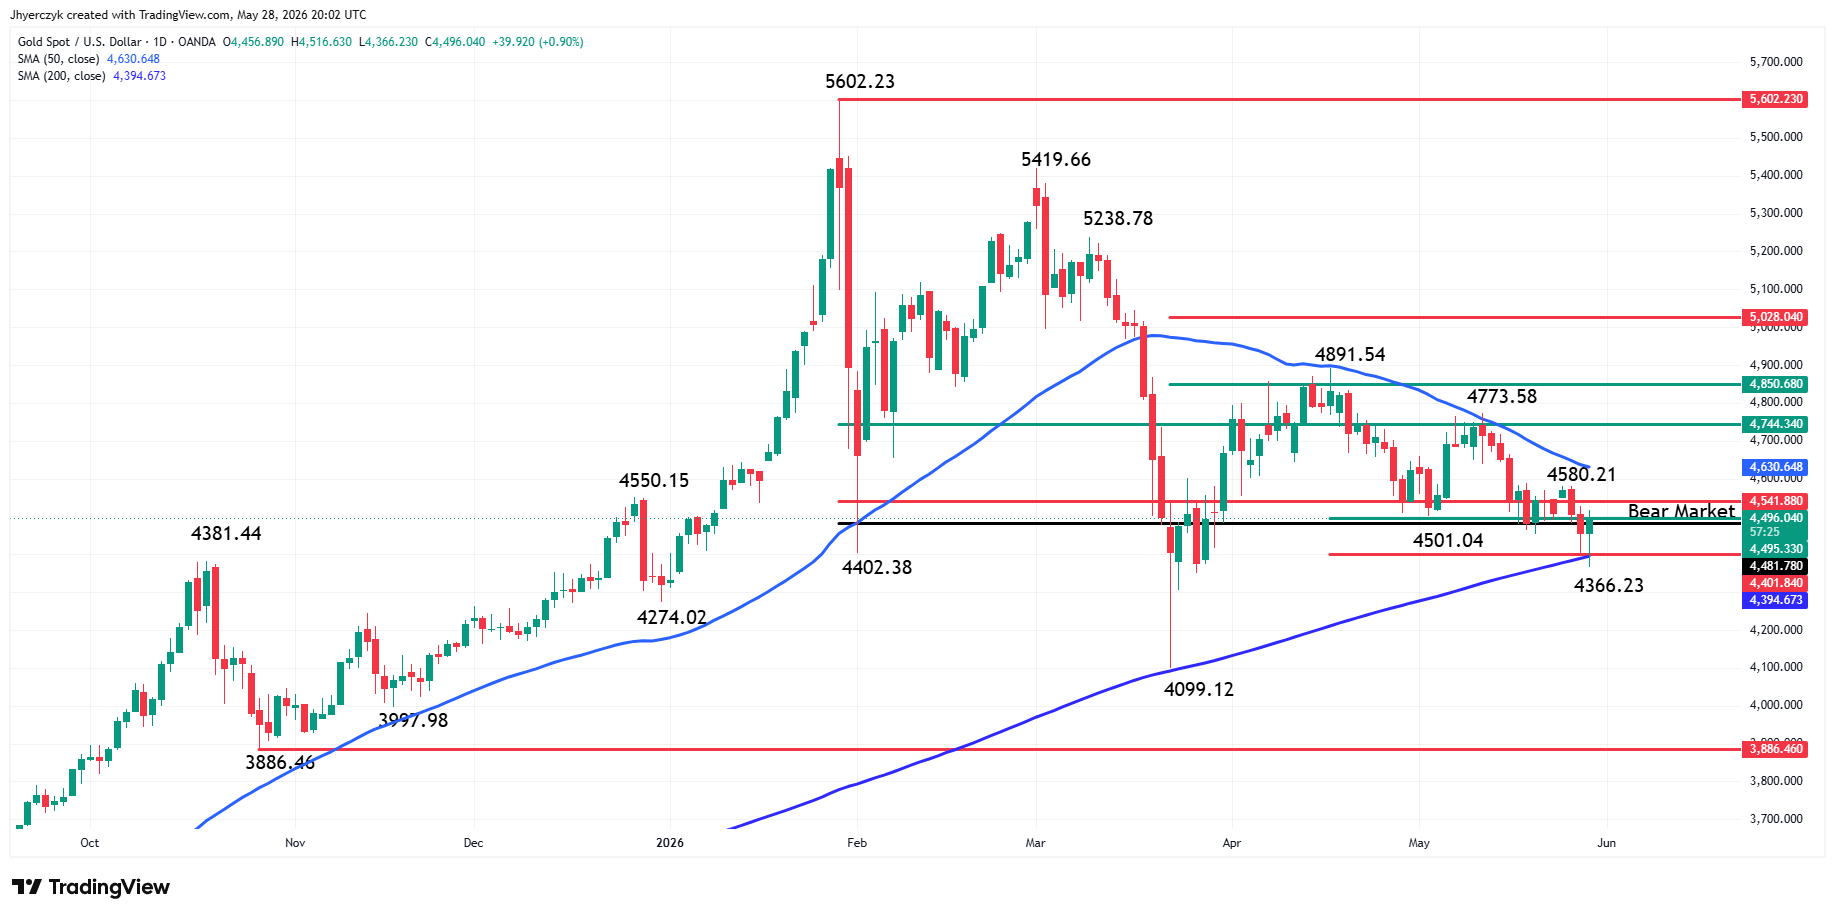
Spot Gold is in a position to close higher on Thursday after reversing earlier weakness. Early in the session, sellers took out the 200-day moving average at $4,394.70 and ran stops to $4,366.23 before mounting a strong recovery that took the market back to $4,516.63, more than 1.00% of the day.
The market is now trading slightly better than the line that separates the Bull market from the Bear market at $4,481.78.
Both moves are early indications of value-seeking buyers especially the formation of a closing price reversal bottom. The key is the follow-through. A follow-through rally on Friday will send further confirmation that a bottom may be in. However, don’t expect a strong rally until buyers can take out the 50-day moving average at $4,630.74 with conviction.
While the 50-day MA may be the indicator to watch for a rally, the 200-day MA is the long-term indicator. The last time Spot Gold spent any noticeable time under the 200-day MA was September to October 2023. Before that, it was at least five months from June to November in 2022.
Keep an eye on trader reaction and order flow at the 200-day MA, this is where the value is. If the longer-term players don’t like it here then we’re likely to go back to the March 23 bottom at $4,099.12 or even sub-$4,000.00.
Gold Price Forecast
Every new Gold analysis as it publishes, today's technical signal and key levels, live price — on one page.
See all Gold forecastsWhy Did Gold Sell Off Hard Thursday Morning?
The morning move lower had a clear chain behind it. The U.S. military struck Iran. Iran’s Revolutionary Guard hit a U.S. airbase in retaliation. Oil stayed elevated because the Strait of Hormuz is still a problem. Higher oil means higher inflation pressure. Higher inflation pressure means the Federal Reserve stays locked in restrictive territory. The 10-Year U.S. Treasury yield climbed on that logic. The U.S. Dollar Index strengthened with it. Spot Gold (XAUUSD) pays no yield. When Treasuries are rising and the dollar is rising at the same time, gold gets sold. That is exactly what happened between the open and the $4,366.23 low.
The gold specific rule held all morning. War escalation pushed oil higher, which pushed inflation expectations higher, which kept the Fed on hold, which made yields and the dollar the trade, not gold. The selling was not random. It was the rate chain working exactly the way it works.
GDP Missed. The Dollar Cracked.
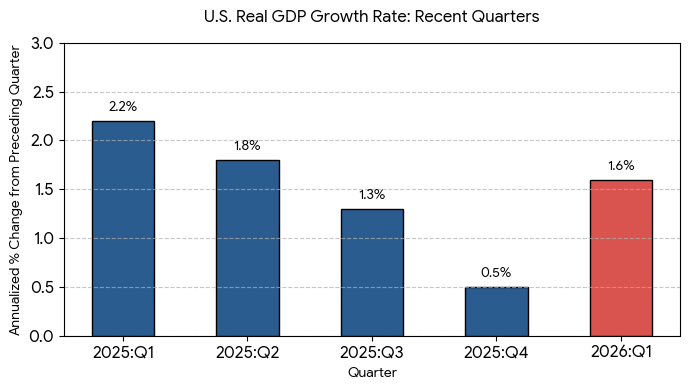
The Commerce Department revised first-quarter Gross Domestic Product down to 1.6% annualized. The original estimate was 2.0%. Economists expected better. They did not get it. The April Personal Consumption Expenditures index landed at 0.4% monthly and 3.8% year-over-year. Right on the forecast. Not hotter. That was enough. The most aggressive rate hike bets started unwinding.
The 10-Year U.S. Treasury yield pulled back from its morning highs. The U.S. Dollar Index turned lower. Two reports in the same hour and both of them gave Spot Gold (XAUUSD) room to breathe. The metal was sitting at $4,366.23 when the numbers dropped. It did not stay there long.
The Fed Is Trapped and Gold Knows It
Growth at 1.6% with inflation at 3.8% puts the Federal Reserve in a corner it cannot talk its way out of. Raise rates and the economy breaks. Hold rates and prices keep running. Neither option is bullish for the U.S. Dollar Index. Neither option pushes the 10-Year U.S. Treasury yield higher from here. That is why central banks have been buying gold steadily all year. Thursday’s reversal off the 200-day moving average at $4,394.70 proved the bid underneath this market is real. Longer-term money showed up at the exact level it needed to show up. The question is whether they stay.
Then the Ceasefire Headline Landed
Axios reported that U.S. and Iranian negotiators reached an outline for a 60-day ceasefire extension tied to nuclear talks. Oil prices started pulling back on the report. Lower oil means lower inflation pressure. Lower inflation pressure means the Federal Reserve has more room to consider easing eventually. The rate chain reversed direction in one session. The U.S. Dollar Index weakened further. Buyers came back into Spot Gold (XAUUSD) hard and the metal ripped $150 off the lows in hours.
Does the Rate Chain Hold or Break by Friday?
The ceasefire framework and the softer Gross Domestic Product number are both pointing toward lower oil, lower inflation pressure, and eventually lower rates. That chain is bullish for Spot Gold (XAUUSD). But the ceasefire is not signed. The White House denied the memorandum reports. One more military strike reverses the oil move and the rate chain turns back against gold by morning.
The 200-day moving average at $4,394.70 held Thursday and that is the floor. The 50-day moving average at $4,630.74 is the ceiling. A follow-through rally Friday confirms the reversal. A failure to hold $4,481.78 says Thursday was a dead cat bounce and $4,099.12 is back on the table.
If you’d like to know more about how to trade gold, please visit our educational area.