
Precious Metals Fundamentals Supported by Central Bank Demand and Supply Limits
Long term, gold and silver prices are underpinned by official-sector buying and slow growth in new-supply growth as of July 7.
Central banks in recent years have bought and stockpiled significant quantities of gold and some silver. This has happened against the background of the increase in levels of public debts and the shift of monetary regimes, and these purchases are the foundation that supports the longer-term gold market and is largely separate from the speculative investment market.
Primary gold mine supply growth has remained subdued over the past several years owing to rising costs of mine development and aging ore deposits. Silver mine production growth has also been limited although a good portion of silver production is a by-product of the output of other base metals such as copper, lead, and zinc.
The amount of recycled gold and silver supplied by the market is sensitive to precious metal prices, although there are other factors that determine recycling volumes (for example, the demand for gold bars, coins and exchange-traded funds, and for industrial users to consume silver.)
Silver has its own fundamental profile as it is used in many industrial fabrication processes (solar cell applications and other electrical uses being the most important examples.) This silver demand component has expanded rapidly in parallel with the transition to renewable energies and the electrification of industrial processes.
So in short the longer term price picture for gold and silver rests on central bank demand, slow new mine supply growth, and industrial demand (particularly for silver.) Other fundamental factors, for instance the level of debt, inflation, and fiscal trends, can impact the prices over time.
Gold Spot Holds $4,127 – Downward Trendline Breakout on 4h
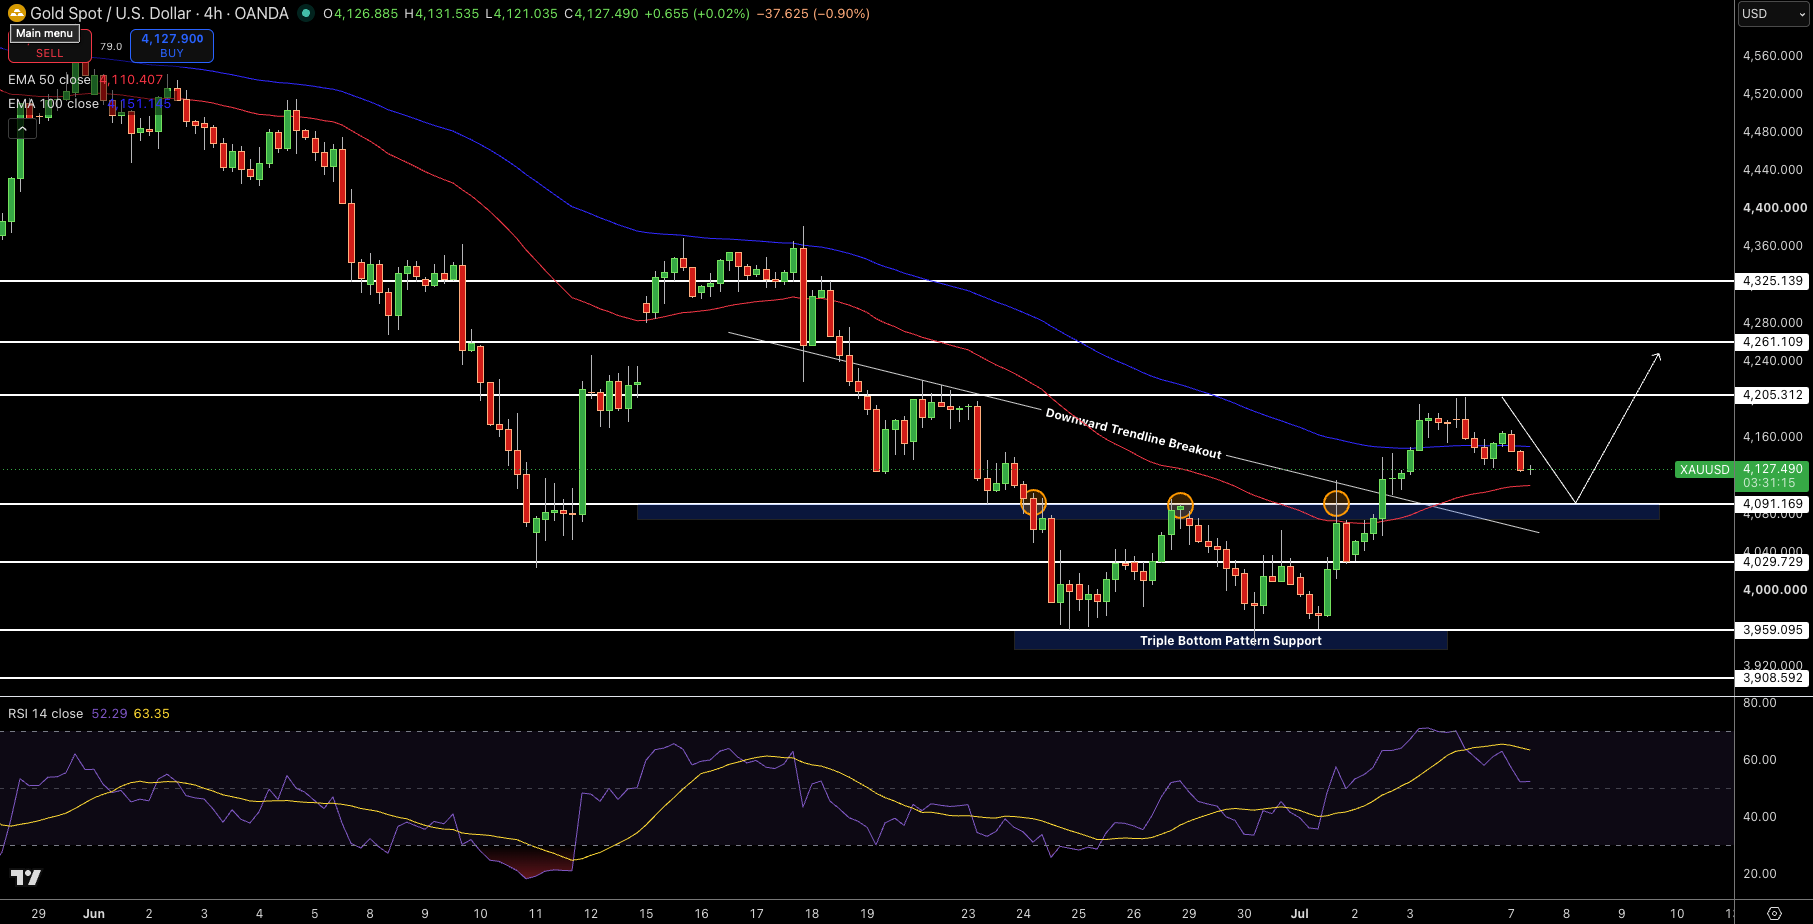
Gold Spot is trading at $4,127 on the 4h timeframe. Mixed candles green and red, managed to move up and break above the downtrend near $4,091 level, following a defence of a triple bottom support near $3,959 level. Bullish rejection wicks on lower price levels, along with the formation of higher lows, are signs of buying pressure absorbing at support levels. RSI reading is near 52, which implies a neutral market sentiment. The volume profile highlights $4,000 to $4,091 price range, which could act as a key accumulation area.
The blue 50 Period EMA at $4,110 level has turned into support, and the price structure above $4,091 level, has now turned into a neutral to bullish sentiment, in light of the broader downtrend from the $4,597 highs on the 4h chart. Gold is now finding support at key Fibonacci zones as the price continues to form higher lows in the short-term, which should keep buyers active at current price levels.
Trade Idea: Buy at $4,127 level, targeting $4,205 price level, with stops at $4,091 level.
Gold Price Forecast
Every new Gold analysis as it publishes, today's technical signal and key levels, live price — on one page.
See all Gold forecastsSilver Spot Holds $60.69 – EMA 50 Defense on 4h
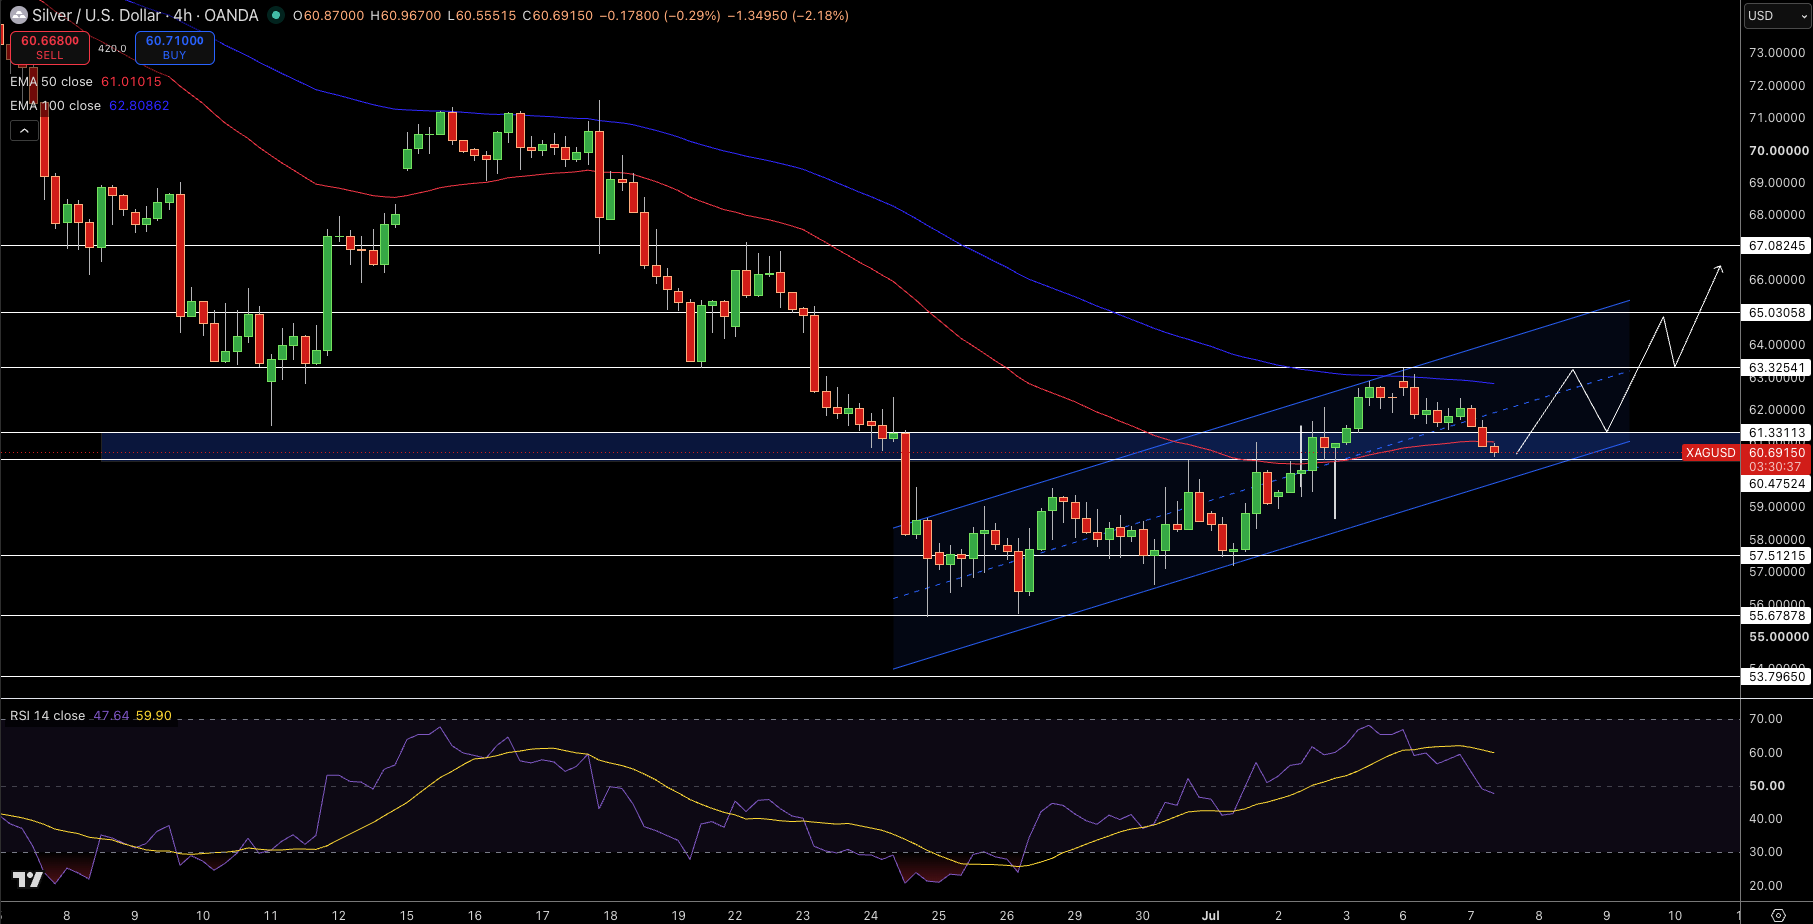
Silver is trading at $60.69 on the 4h timeframe. Mixed candles green and red, managed to move up and bounce off the 50 Period EMA near $61.01 price levels, following a plunge from the $69.85 highs on the 4h chart. Bullish rejection wicks on lower price levels, along with the formation of higher lows from the $57.12 swing lows, are signs of buying pressure absorbing at support levels.
RSI reading is near 48, which implies a neutral market sentiment. The volume profile highlights $58 to $61 price range, which could act as a key fair value cluster zone. The next price level where we could observe selling pressure would be within $61.33 to $62.81 zone.
Despite the broader downtrend on the 4h chart, the price structure above the 50 Period EMA, has now turned into a neutral to bullish sentiment. The formation of higher lows on the lower time frame is likely to keep buyers active at current price levels on the Silver Spot.
Trade Idea: Buy at $60.69 level, targeting $61.33 price level, with stops at $59.00 price level.