The MIB initially fell during the course of the week, testing the 18,000 level for support. We found it there, and then turn right back around to reach
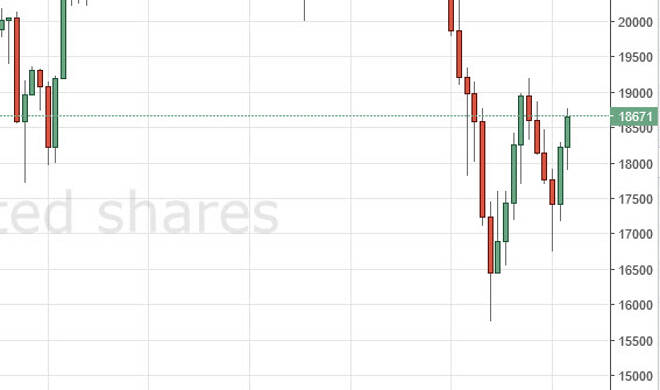
The MIB initially fell during the course of the week, testing the 18,000 level for support. We found it there, and then turn right back around to reach towards the 19,000 handle. If we can break above the 19,000 level, the market should continue to go much higher. It looks as if we are going to do that, but it’s not until we clear the 19,000 level that we feel a longer-term signal is possible to take in this market. We have no interest in selling the MIB at the moment.
Chris is a proprietary trader with more than 20 years of experience across various markets, including currencies, indices and commodities. As a senior analyst at FXEmpire since the website’s early days, he offers readers advanced market perspectives to navigate today’s financial landscape with confidence.