


NASDAQ 100 Technical Analysis
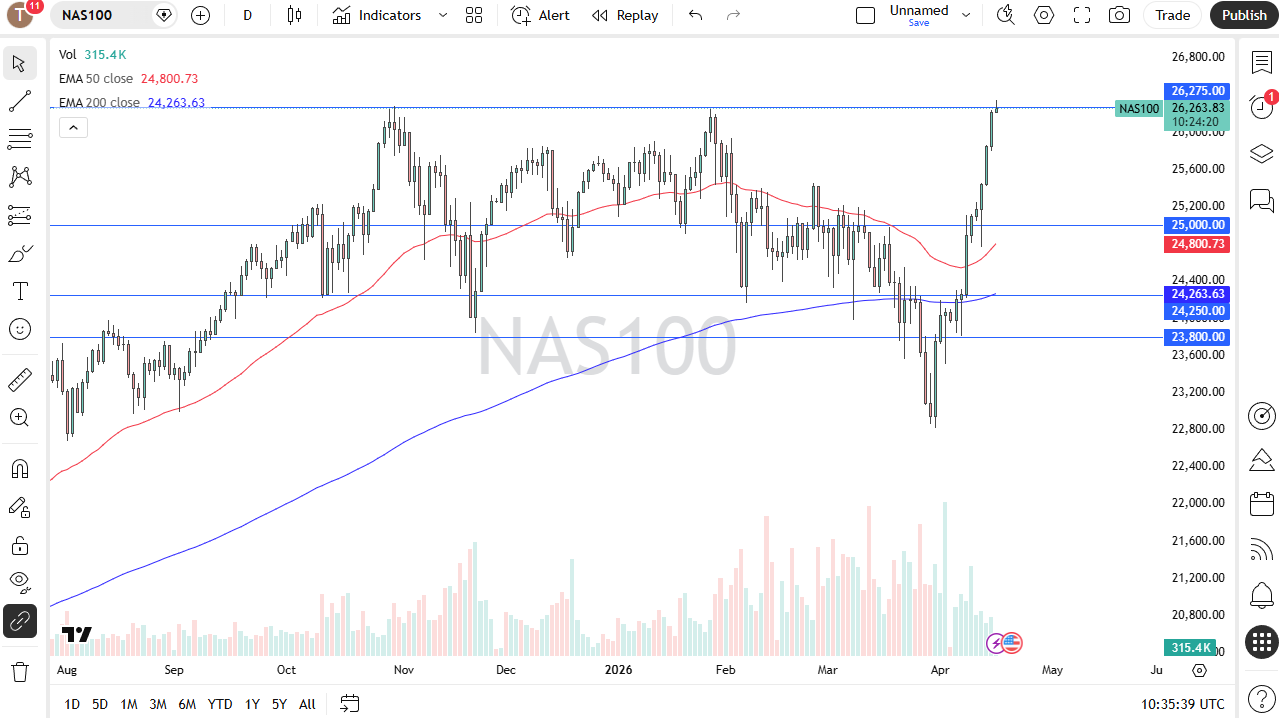
The Nasdaq 100 rallied a bit in the early part of the trading session here on Thursday, but truth be told, we are a little overstretched, so I think you have to be somewhat cautious being aggressively long here. I would anticipate a pullback, although I’m not really willing to short this market, it’s far too strong.
Essentially, I’m going to wait for maybe a red day or two to get involved. If we break above the high of the session for the day, then I shift my focus to paying attention to whether or not 26,275 ends up offering support after a breakout. Ultimately, there’s just no way to short these markets.
Dow Jones 30 Technical Analysis
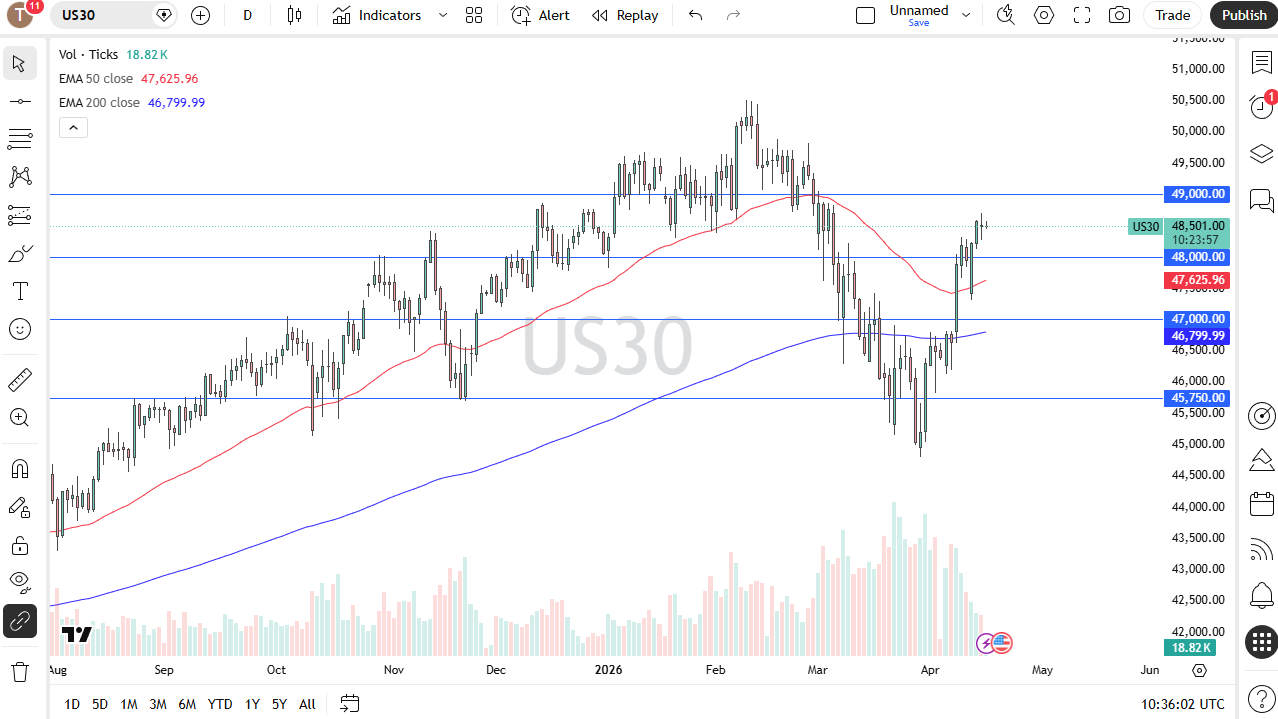
The Dow Jones 30 looks somewhat stuck at the moment in a little bit of a short-term range. This is probably a little healthier move as it’s not straight up in the air. A little bit of sideways action here probably goes a long way to work off some of the excess froth that we’ve recently seen, and I still look at the Dow Jones 30 as having an important level in the form of 48,000, which, at least in theory, should offer support.
A pullback to that area and a bounce for me at least gets very interesting, 49,000 above being the next target.
S&P 500 Technical Analysis
NASDAQ 100 Price Forecast
Every new NASDAQ 100 analysis as it publishes, today's technical signal and key levels, live price — on one page.
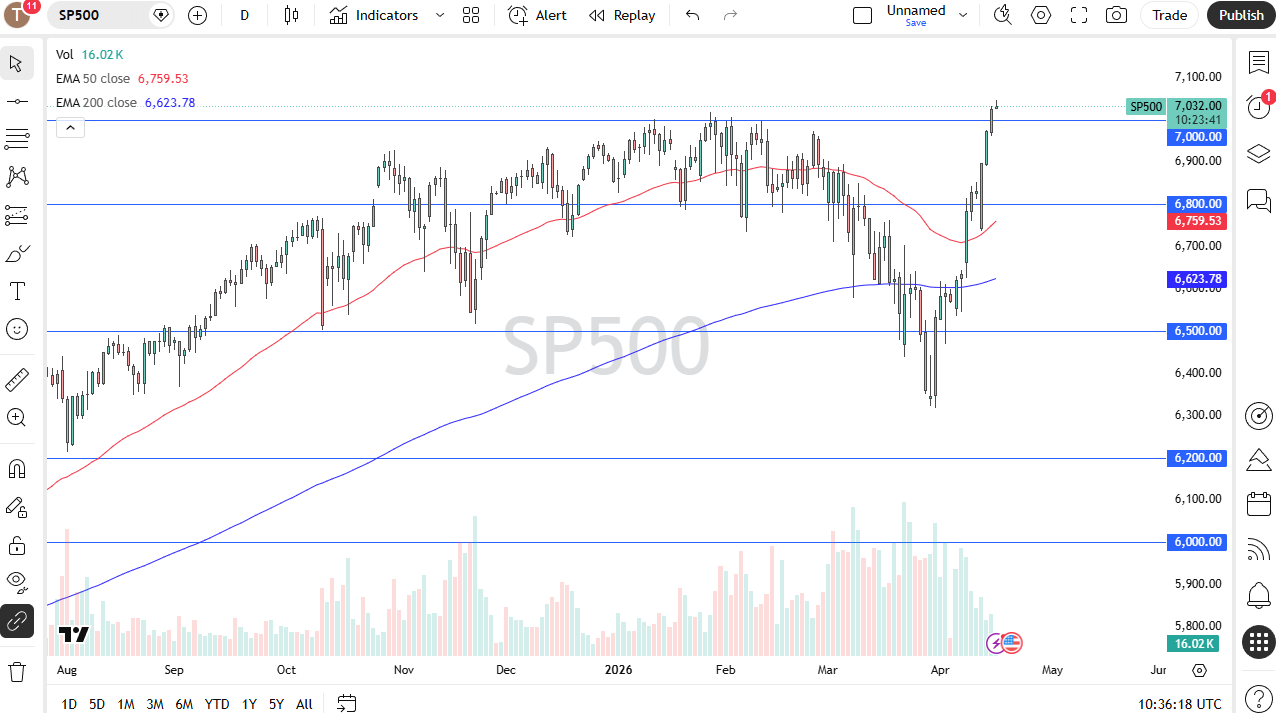
See all NASDAQ 100 forecastsThe one that has broken out is the S&P 500. I’m going to watch to see what happens when it reaches 7,000. If we get down there and it bounces, I’d be very interested. It’s still a little overdone, though. I suspect we probably have some sideways action waiting to figure out whether or not peace in the Middle East can actually be a thing, and we’ll probably also watch the 10-year yield to see how that behaves.
The 4.30 level in the 10-year yield is a bit of a trigger point. If we get above there, that probably sends the S&P 500 lower; it would be a short-term move, my guess, but it would also be healthy. We’ve gone straight up in the air over the last couple of weeks, it probably needs a pullback here.
If you’d like to know more about chart patterns and how to trade them, please visit our educational area.