The natural gas markets initially fell during the week but found enough support just below the $2.50 level to turn around and form a hammer. I believe
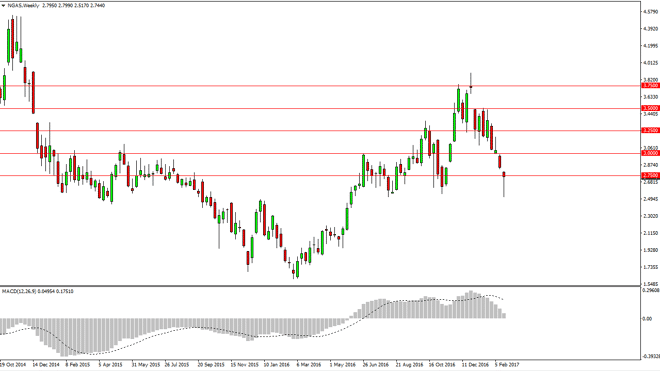
The natural gas markets initially fell during the week but found enough support just below the $2.50 level to turn around and form a hammer. I believe that we are going to see a bit of a bounce here, but that bounce will only end up being a nice selling opportunity in the end. Alternately, if we can break down below the bottom of the hammer, the market should then reach towards the $2.25 level. Even if we do get this bounce, I have no interest trying to buy this market.
Chris is a proprietary trader with more than 20 years of experience across various markets, including currencies, indices and commodities. As a senior analyst at FXEmpire since the website’s early days, he offers readers advanced market perspectives to navigate today’s financial landscape with confidence.