



Shorts Got Squeezed but the Surplus Is Still There
September natural gas ran nearly 5% Monday on the back of a hotter forecast and the biggest short squeeze since 2020. Tuesday is a different conversation. The rally stalled just under a key retracement level and production has not gone anywhere. Storage is still 195 Bcf above the five-year average and the last weekly build came in heavier than expected even with warm weather. The squeeze moved price. Thursday’s storage number decides whether price stays moved.
At 10:43 GMT, September natural gas futures were trading at $2.755, down $0.039 or 1.40%.
Monday’s surge pierced a key retracement level before pulling back, and the failure to hold above it keeps the downtrend intact on the swing chart. The short-covering moved fast but it did not break the pattern of lower highs.
Daily September Natural Gas Futures Technical Analysis
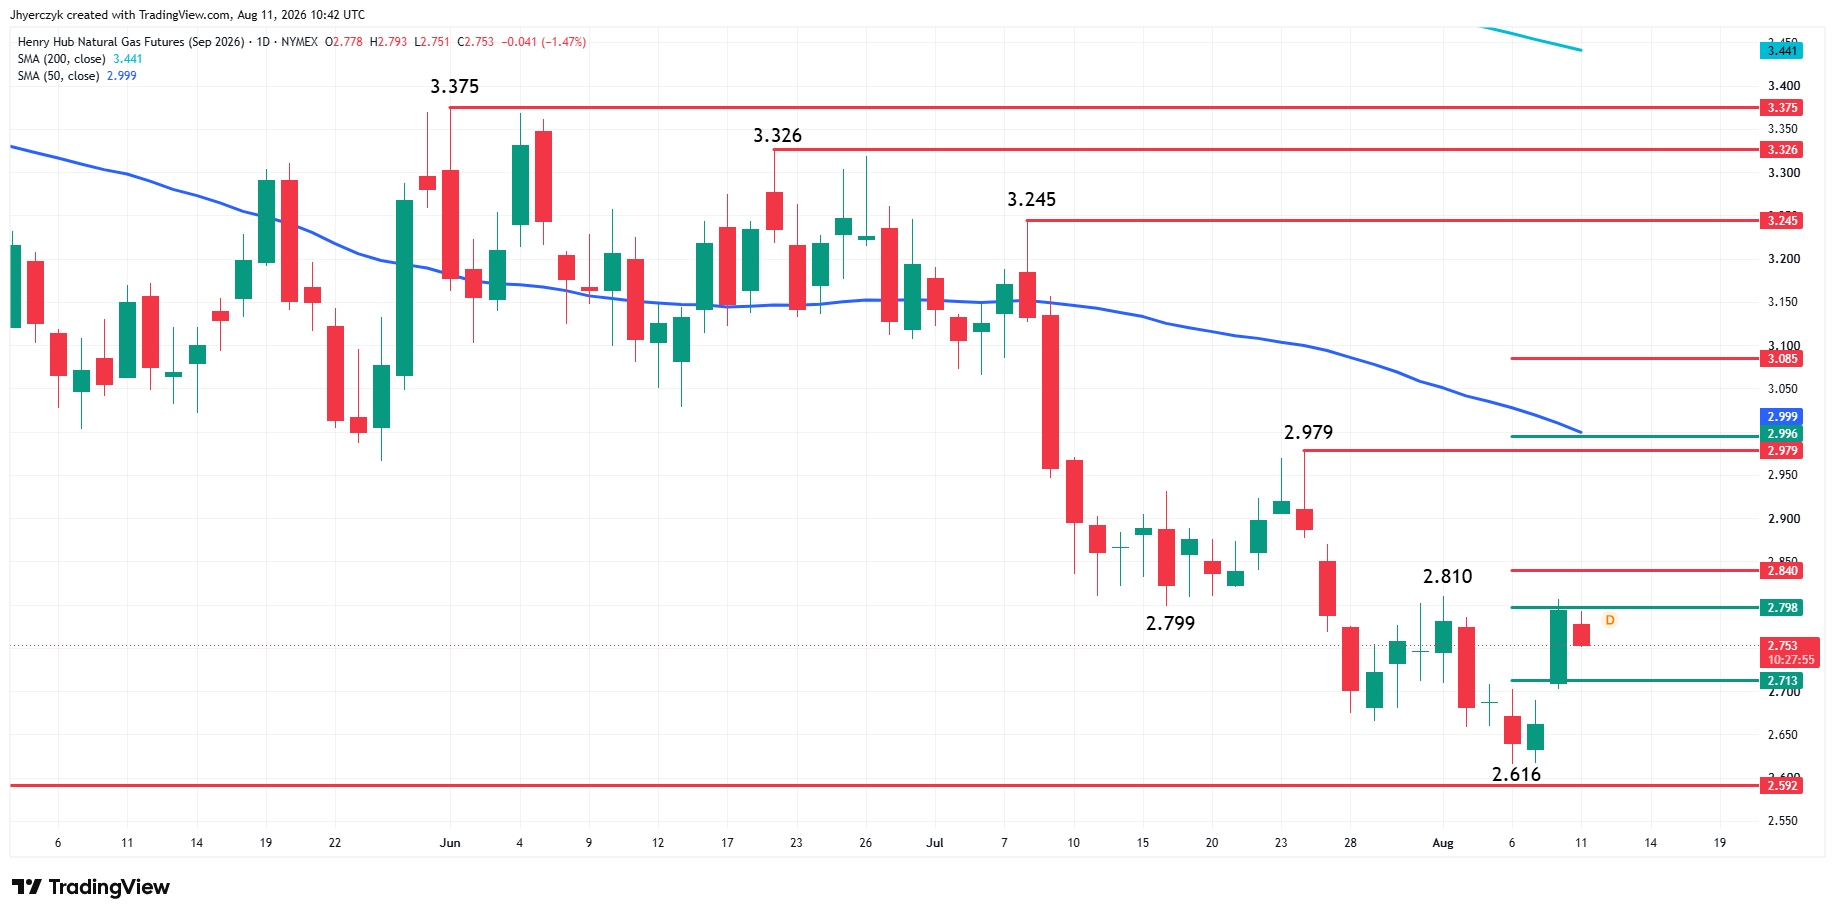
September natural gas futures are edging lower early Tuesday after failing to follow through to the upside following Monday’s surge to $2.806. This high briefly pierced a 50% level at $2.798, while falling short of a swing top at $2.810. The price action suggests short-covering was behind the move.
The minor range is $2.810 to $2.616. Its 50% level at $2.713 is a potential support. The short-term range is $2.979 to $2.616. Its retracement zone at $2.798 to $2.840 is a potential resistance.
The main trend is down according to the swing chart. A trade through $2.810 will break the pattern of lower highs. Overtaking the Fibonacci level at $2.840 will indicate the buying is getting stronger.
The daily chart indicates there is plenty of room to the upside over $2.840 with potential targets at the July 24 main top at $2.979, a long-term 50% level at $2.996 and the 50-day moving average at $2.999.
Overtaking the 50-day moving average with conviction could be a sign of serious buying and not just short-covering and buy stops. This could extend the rally into a Fibonacci level at $3.085. This is a potential trigger point for an acceleration to the upside with the major tops at $3.245, $3.326 and $3.375 the next likely targets.
On the downside, if $2.713 fails as support, it may not be particularly bearish. It may just mean that bullish traders are trying to form a support base.
Natural Gas Price Forecast
Every new Natural Gas analysis as it publishes, today's technical signal and key levels, live price — on one page.
See all Natural Gas forecastsThe Biggest Short Squeeze Since 2020 Ran Into a Fat Storage Number
Hedge funds were carrying their largest net-short position in Henry Hub since 2020, with short-only bets at the highest level since at least 2013. Weekend forecasts turned sharply hotter across the central and southern United States, temperatures running from the upper 80s to 110 degrees through Tuesday, and the covering was immediate.
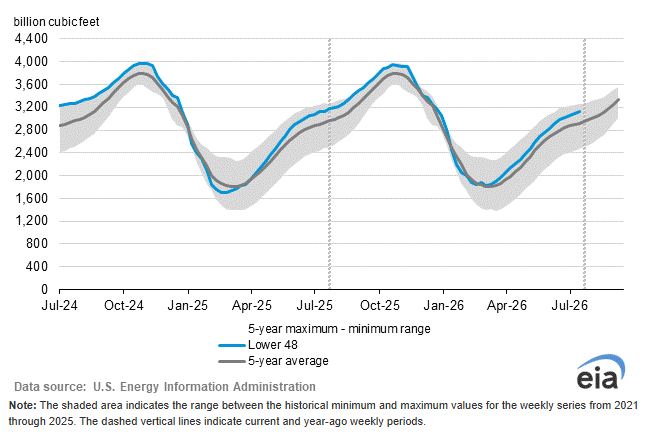
That move has limits. Short-covering cleans up positioning but it does not change the injection number. Last week’s build came in at 33 Bcf against a 30 Bcf estimate and a five-year average of 23 Bcf. Storage is 195 Bcf, or 6.7%, above the five-year seasonal norm. The weather was already warm when that number printed.
The southern two-thirds of the country stays hot through the weekend with readings in the 90s and 100s. The northern United States cools into the 70s and 80s. Traders are not chasing Monday’s rally without Thursday confirming the heat is biting into supply.
LNG Demand Is Rising but September Brings More Gas to Henry Hub
LNG feedgas reached 18.7 Bcf per day Monday, the highest reading in more than a month and up 6.9% from the prior week. European gas prices jumped 11% Monday to a two-week high with Hormuz keeping supplies tight, and Europe entered August with storage at 58% against a five-year average of 74%. The export market has a reason to keep pulling.
Production is the other side of that. Lower-48 dry gas output hit 113.1 Bcf per day Monday, up 2.9% year-over-year. Demand was strong at 84.1 Bcf per day, up 9.2%, but production is still running well ahead. The rig count dropped three to 124 last week without slowing output. The Energy Information Administration expects 2026 dry gas production to average 111.2 Bcf per day.
More supply arrives September 1 when Energy Transfer expects the Hugh Brinson pipeline to reach its full 1.5 Bcf-per-day capacity. That routes more Permian gas straight to Henry Hub as summer cooling demand fades from the calendar.
What to Watch
Thursday’s injection number carries all the weight now. The heat and rising LNG feedgas need to show up in a tighter build or Monday’s rally becomes a short-covering event that sellers can fade. Production at 113 Bcf per day and the Hugh Brinson pipeline reaching full capacity September 1 are working against whatever demand gains the forecast delivers.
The contract stalled just under overhead resistance Monday and pulled back without breaking the pattern of lower highs. The downtrend stays intact until the swing chart says otherwise, and that means clearing levels the market could not hold on the first attempt.
More Information in our Economic Calendar.