Chart Action
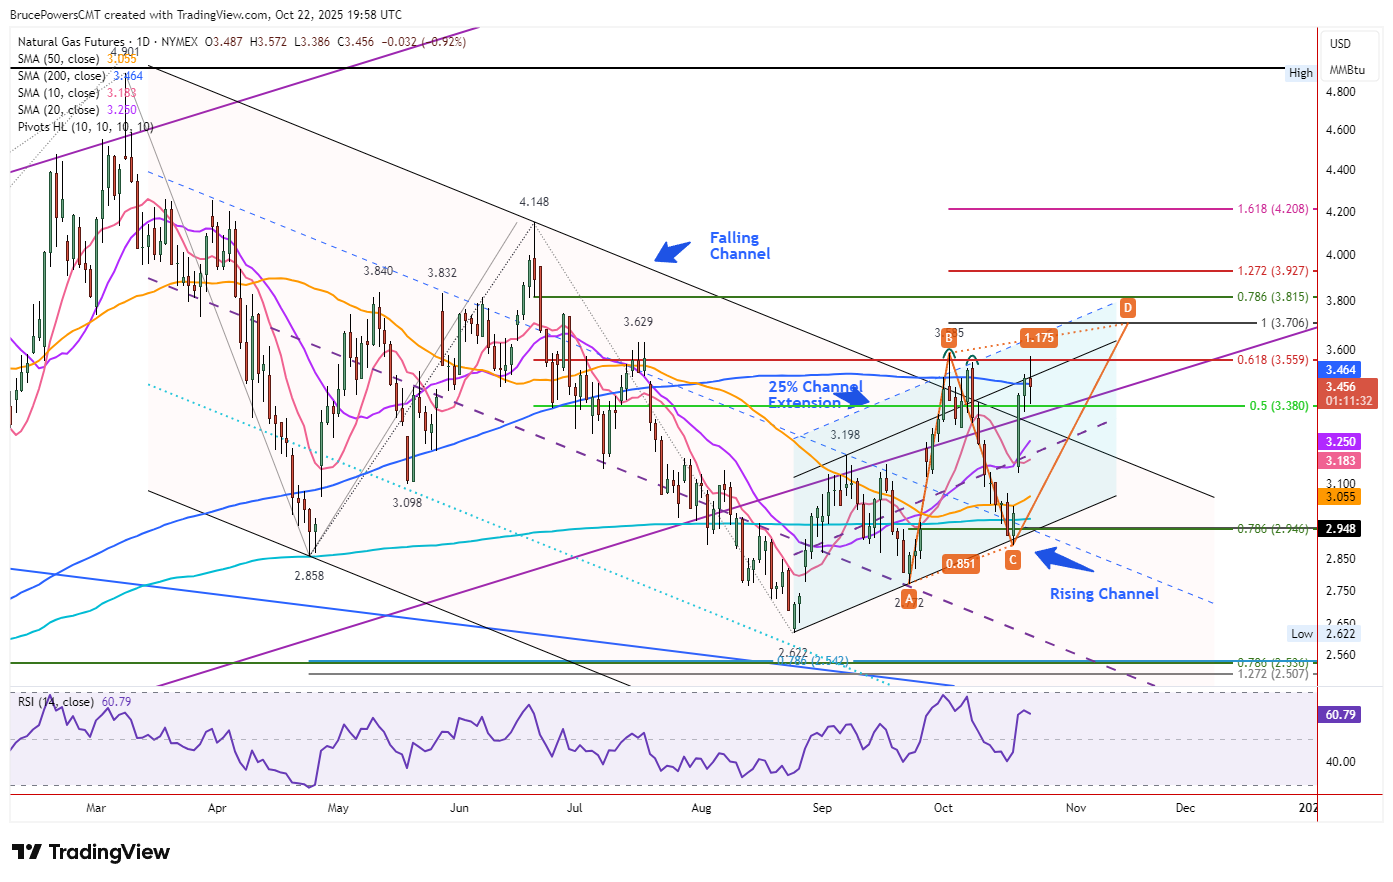
Natural gas powered higher on Wednesday, reaching a new rally high of $3.57 and piercing the 200-day moving average at $3.46 for the second consecutive day. Buyers edged past the early-October double top at $3.55, but sellers pushed back, dragging prices below the 200-day line. Trading lingers there now, suggesting a possible close below the average—weakening the breakout unless it holds above both the 200-day and the rising channel’s top line near $3.45.

Trade Setup
October’s double top stalled at a rising channel level, extended by 25% to capture that advance. Today’s push above $3.55 shows minor bullish strength, but a close above $3.46 and $3.45 is needed to confirm the breakout. Without it, the second-day surge fades. Clearing the $3.59 swing high (B) would spark a bullish reversal, building on the rally from the $2.89 swing low (C).
Upside Targets
A $3.59 breakout targets the 25% extended channel top, with a rising ABCD pattern pointing to $3.71 as the initial harmonic goal. The $3.57 high completed a 61.8% Fibonacci retracement, so surpassing $3.59 would eye the 78.6% level at $3.82 for further upside. Recent channel tests suggest another approach is plausible before the rally exhausts.
Support Levels
The 20-day moving average at $3.25 anchors key dynamic support. Staying above it preserves the near-term bullish bias, even if today’s close weakens. A drop below signals caution, but the structure favors buyers if this floor holds.
Outlook
The $3.46-$3.45 zone is pivotal – close above to lock in strength and aim for $3.59, or below to test $3.25. Today’s close decides: $3.59 opens $3.71 and $3.82, but a failed breakout keeps sellers active. Momentum tilts upward if support stands—watch the triggers for the next swing.
Natural Gas Price Forecast
Every new Natural Gas analysis as it publishes, today's technical signal and key levels, live price — on one page.
See all Natural Gas forecastsFor a look at all of today’s economic events, check out our economic calendar.