Natural gas further retraced its prior advance on Monday as it fell below the long-term downtrend line to reach support at 2.76. That completed a successful test of support at the purple 20-Day MA. It is the first touch of the 20-Day line since natural gas rose above it on April 26.
Since the 20-Day line is showing support so far, there is a possibility that today’s low completes the retracement. The low price today also completes a successful test of support around the top of the bull pennant pattern.
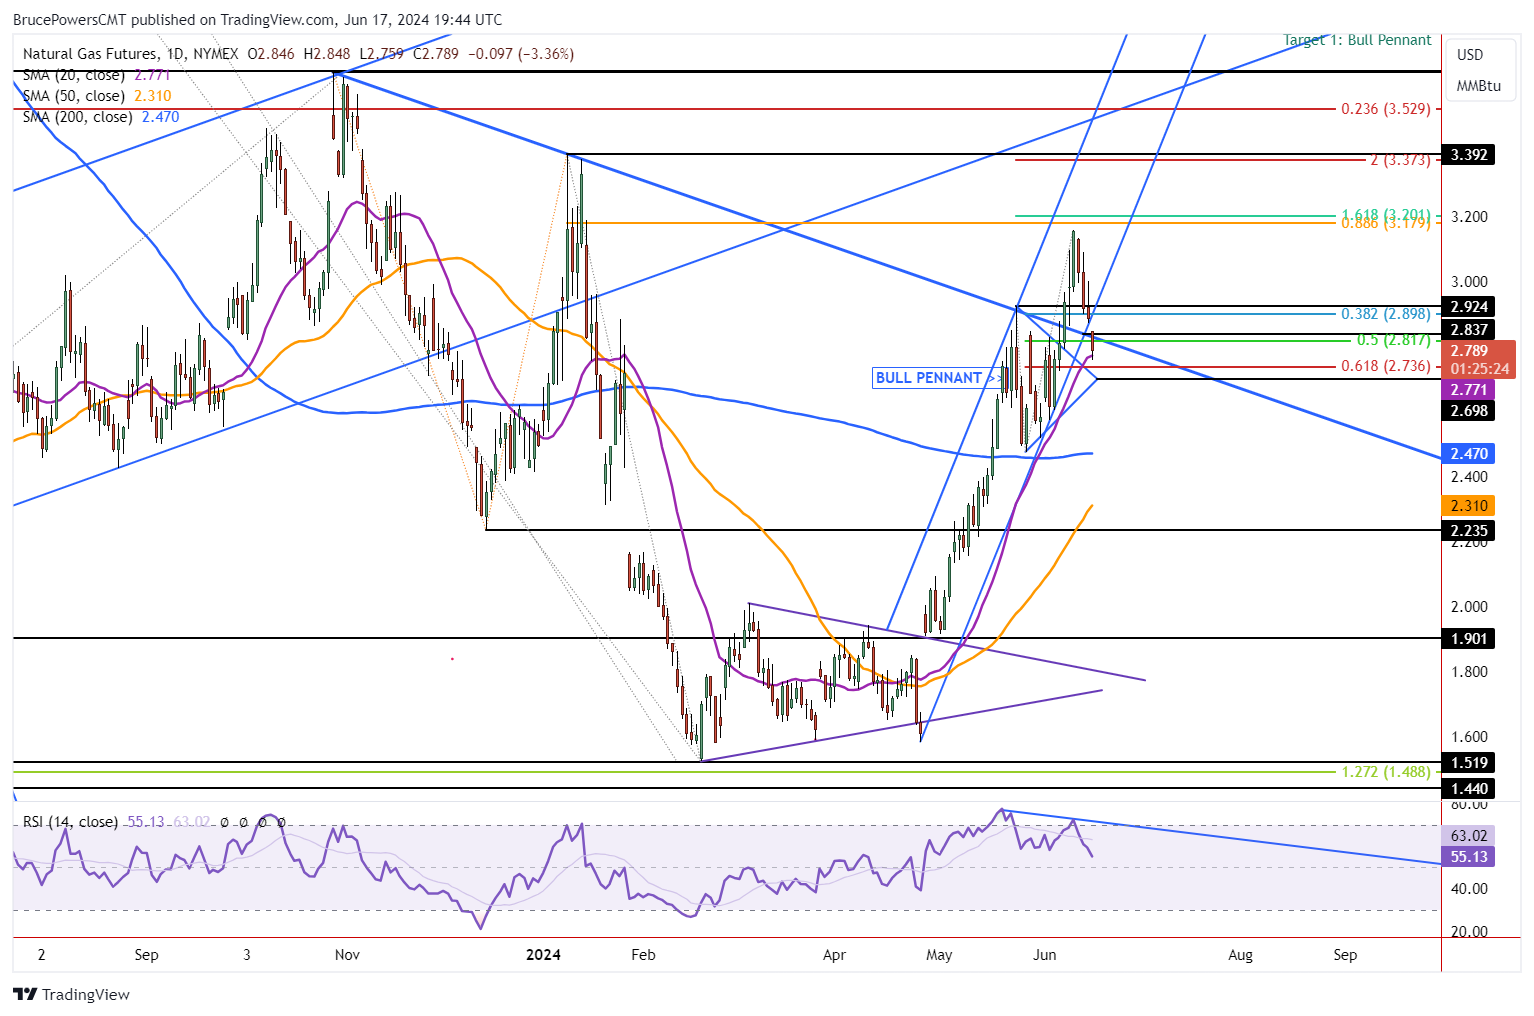

Test of 20-Day Line Might Complete Retracement
Lower prices begin to put recent bullish activity at risk of failure. Although there could still be a brief drop lower in the short term, if a quick recovery follows it will put natural gas back in a position to progress its uptrend. The 61.8% Fibonacci retracement level is at 2.74. If the 20-Day line is busted, currently at 2.76, then natural gas will likely reach the 2.74 area.
If support is seen from there, followed by a recovery above the 20-Day line, the bullish price structure will be maintained. However, a drop below the 20-Day line where natural gas then stays below the line, will be short-term bearish. A failure of the bull pennant breakout is indicated on a drop below the center line at 2.70.
Rally Above Today’s High of 2.85 Shows Strength
If a bullish setup completes today, then a decisive breakout above today’s high of 2.85 will be a sign of strength. Today’s candlestick pattern may take the form of a bull hammer candlestick pattern. A daily close in the top third of the day’s range will be a stronger indication than a close lower than the top third of the range. A decisive advance above today’s high would then be a sign of strength that should continue to higher prices.
Bearish Weekly, but Quick Bullis Recovery Will Negate Implications
Today’s decline in natural gas also triggered a bearish reversal on a weekly time frame. The weekly pattern last week was of a bearish shooting start candle. It triggered today on a drop below 2.86 and it will confirm on a daily close below that price level.
Natural Gas Price Forecast
Every new Natural Gas analysis as it publishes, today's technical signal and key levels, live price — on one page.
See all Natural Gas forecastsFor a look at all of today’s economic events, check out our economic calendar.