Support Confluence Under Pressure
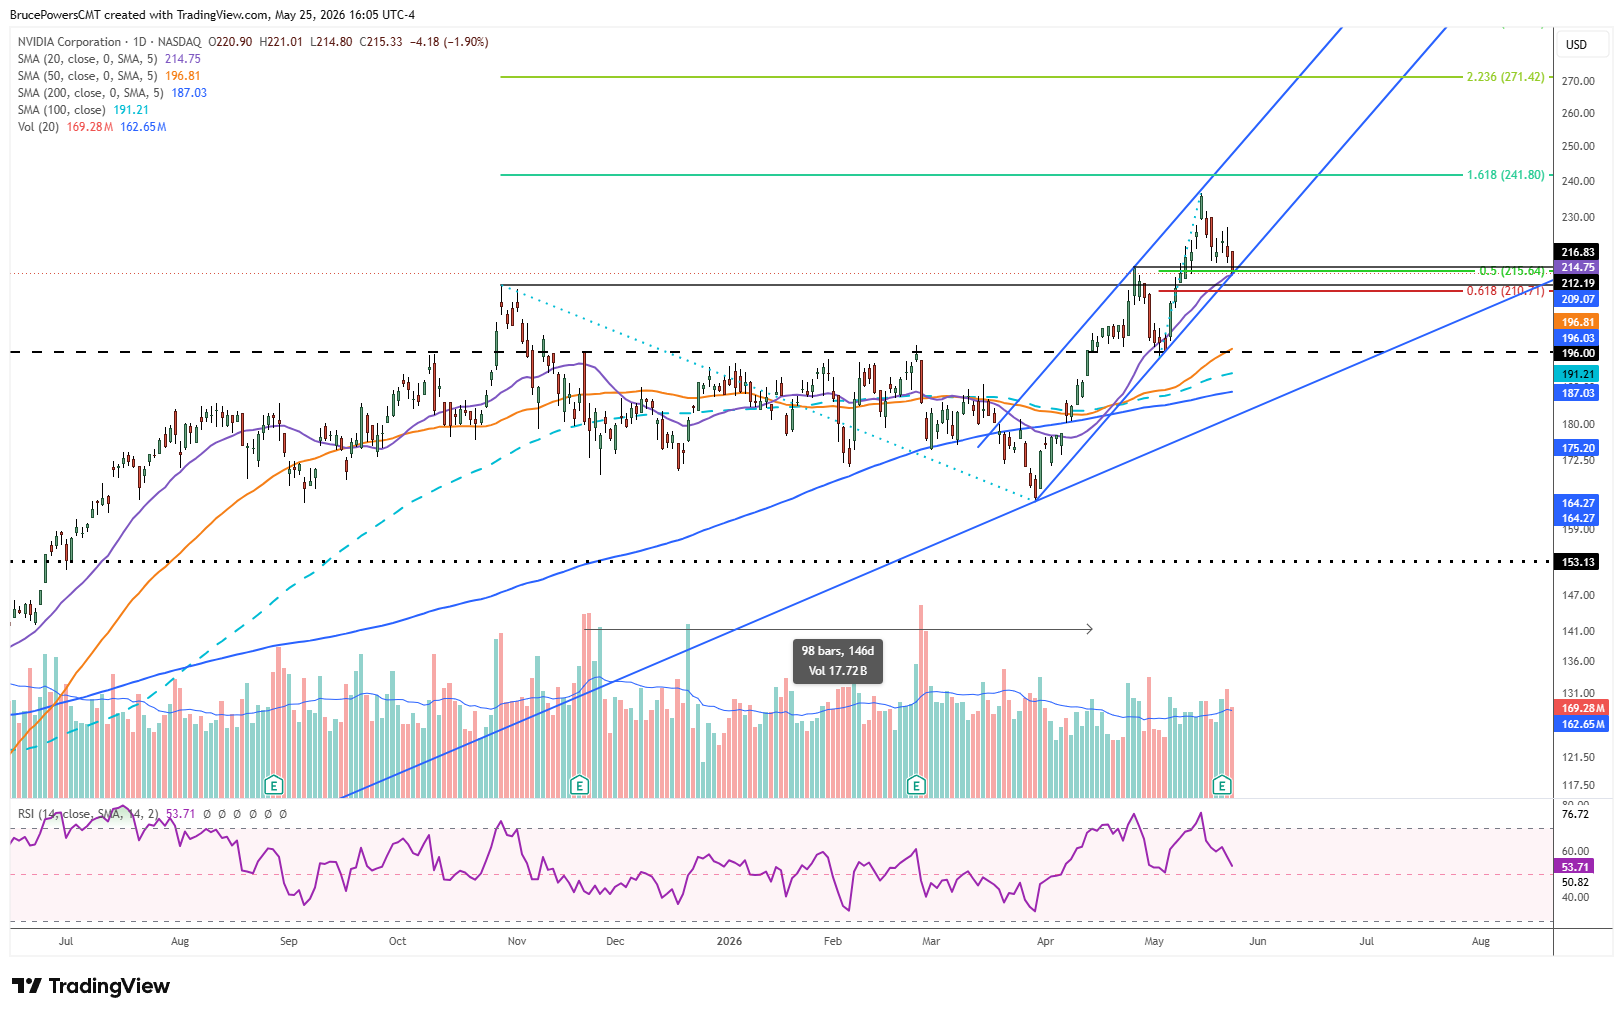
Nvidia Corporation (NVDA) stock has pulled back to a key near-term potential support zone that could attract buyers. On Friday, NVDA hit a low of $214.80, finding support near the confluence of the 50% retracement of the prior advance, an uptrend line, the prior peak from April, and the 20-day moving average. However, the session ended with sellers clearly in control, as the stock closed near the low of the session. If the support zone is retained, the near-term and long-term bull trend are set to continue into higher prices.

Post-Breakout Trend Structure
NVDA broke out of a 21-week basing period on April 15 before advancing to a new high at the time of $216.83 on April 27. The breakout was confirmed with a close above the prior trend high of $212.19 form October. The first pullback following that high found support near the 20-day moving average and the high zone of the base, resulting in a higher swing low. That correction established the 20-day moving average as key support for the advance.
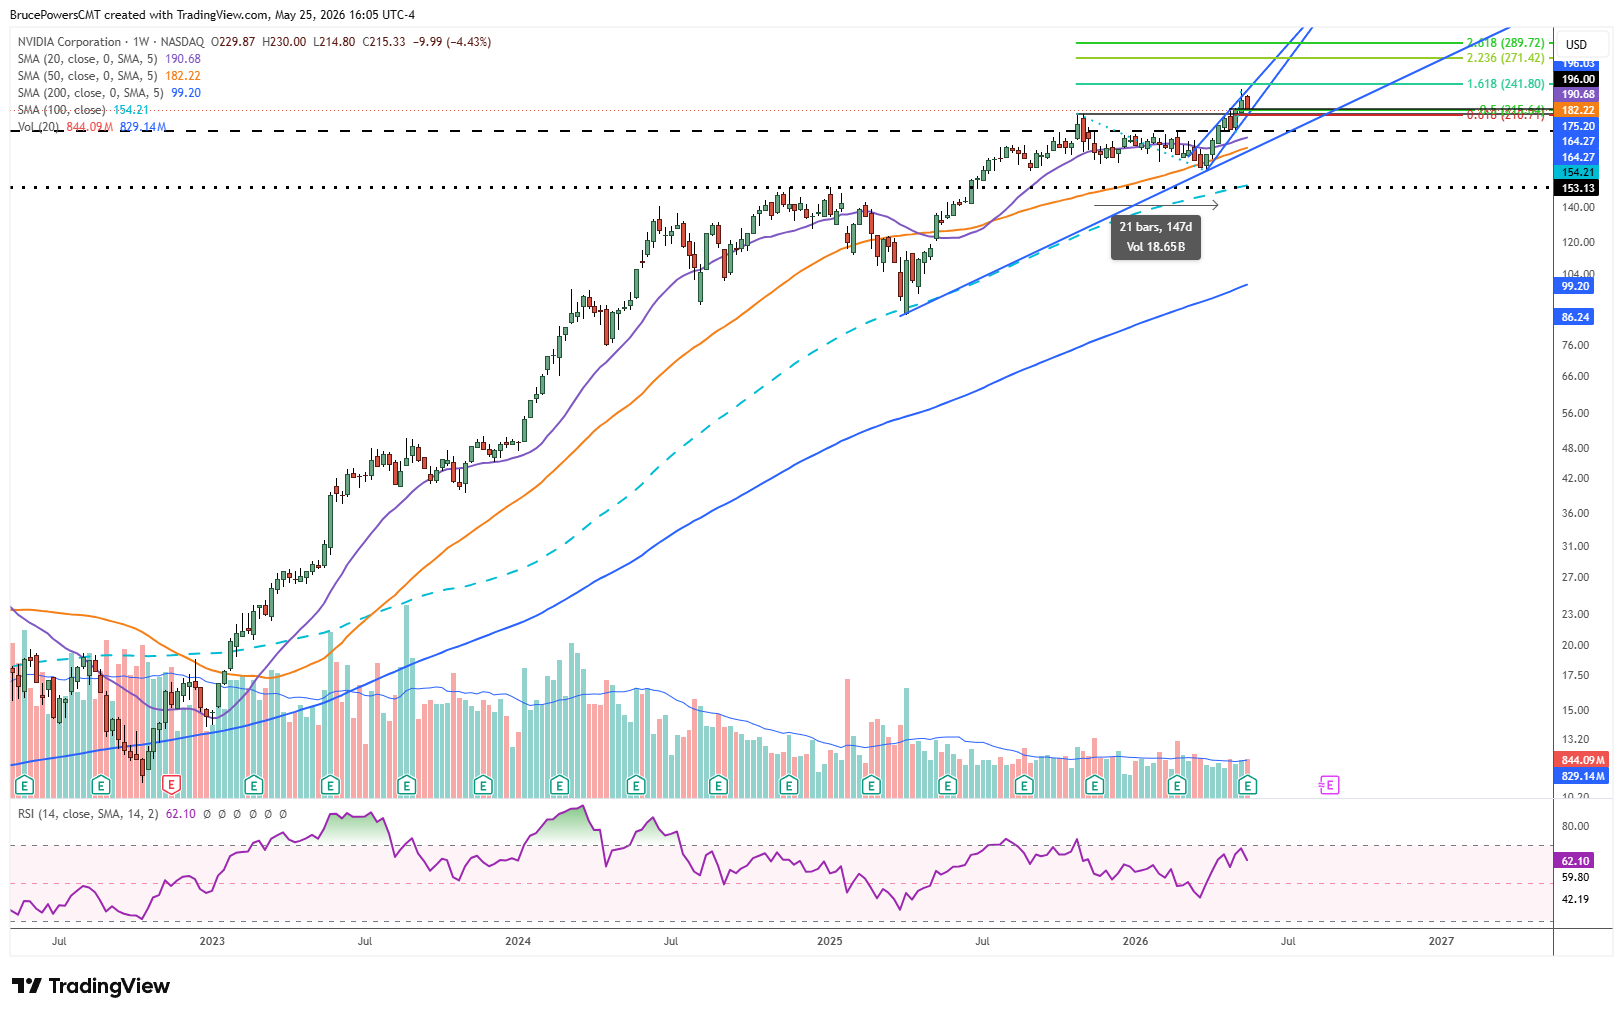
That pullback was followed by a sharp rally to a new high of $236.54, followed by a correction to Friday’s low. The near-term bull trend is defined by support near the 20-day moving average, while the long-term trend is marked by support near the 200-day moving average. That longer average was successfully tested as support in March, resulting in the current advance.
Key Levels Defining Bull vs Bear Path
Given the potential significance of prior trend highs becoming support, as seen in the prior pullback, a similar scenario may unfold with the current situation. Since support levels are areas of potential interest from buyers, an undercut of the 20-day average could occur, possibly to test support near the peak from October at $212.19 and the 61.8% Fibonacci retracement of the prior upswing.
Reversal Triggers and Breakout Thresholds
A recovery above the lower swing high of $227.04 from Thursday will trigger a bullish reversal based on structure, while a one-day reversal triggers above Friday’s high of $216.83. There is also the inside week from last week that triggers an upside weekly breakout above $230.00.
Trend Outlook Remains Constructive
Taken together, NVDA remains in a constructive longer-term uptrend, with the current pullback representing a test of whether prior breakout levels and the 20-day moving average can continue to act as dynamic support or whether a deeper retracement phase is beginning.
If you’d like to know more about technical analysis and how traders use it, please visit our educational area.