


The New Zealand dollar initially fell during the week but found enough support at the 50% Fibonacci retracement level of the larger move to turn around and form a hammer. Because of this it looks as if the buyers are coming back into the marketplace, and will eventually go looking for the 0.75 handle above. I have no interest in shorting this market, although I would need to see a break of the weekly candle to start buying. This is a market that probably grind for a while, but has an upward proclivity.
Advertisement
Advertisement
NZD/USD forecast for the week of September 18, 2017, Technical Analysis
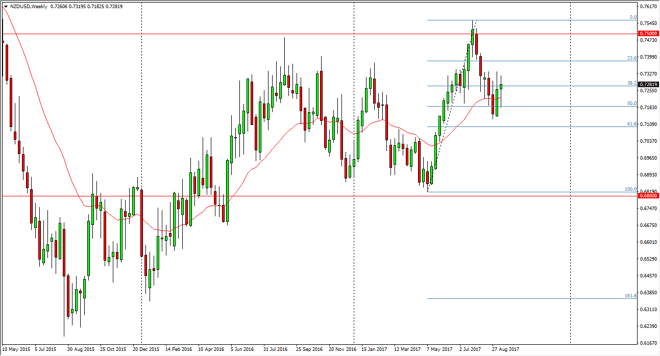
The New Zealand dollar initially fell during the week but found enough support at the 50% Fibonacci retracement level of the larger move to turn around
Loading
About the Author
Christopher LewisSenior Analyst
Chris is a proprietary trader with more than 20 years of experience across various markets, including currencies, indices and commodities. As a senior analyst at FXEmpire since the website’s early days, he offers readers advanced market perspectives to navigate today’s financial landscape with confidence.
Latest news and analysis
- Loading
Advertisement
Loading
Advertisement
Advertisement
Advertisement