Advertisement
Advertisement
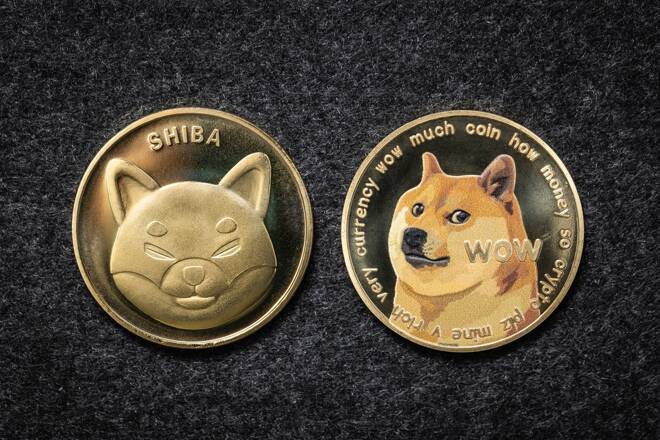
SHIB Finds Support after Two Days in the Red, with DOGE in Pursuit
By:
It's a bullish start for DOGE and SHIB. Support from the broader market would be needed for another run at the day's second major resistance levels.
Key Insights:
- It was a bearish start to the week for DOGE and SHIB.
- The pair tracked the broader market into the red, with SHIB in the red for a second consecutive day.
- Key technical indicators are bullish, with DOGE and SHIB breaking out from their 100-day EMAs.
It was a mixed day for DOGE and SHIB on Monday. Bearish sentiment across the broader crypto market pegged back the pair at the start of the week.
Following a 3.56% slide on Sunday, DOGE recovered losses to end the day flat at $0.1193. SHIB followed a 4.35% decline from Sunday, with a 0.61% fall to end the day at $0.00002296.
SHIB News and Market Risk Sentiment Delivers Solid Gains
In recent days, news updates have been bearish for SHIB. On Saturday, news of the SHIB community burning 189.7 million SHIB Inu had provided support before reports of falling SHIB holders.
News of SHIB holders in decline has weighed on SHIB. According to CoinMarketCap, SHIB holders fell from 1,199,453 to 1,166,621 on March 17 and have declined further from March 18 through to March 21. As of March 21, SHIB holders stood at 1,155,819, a fall of 32,832 from March 16 levels.
DOGE saw a sizeable decline on March 11, with the total number of holders tumbling from 4.8 million to 4.2 million.
The declines are in contrast to other cryptos such as LUNA, which has seen an upward trend in recent days, as shown below.
Technical Indicators
DOGE will need to hold above the First Major Resistance Level at $0.1214 to take another run at the Second Major Resistance Level at $0.1235.
Support from the broader crypto market is needed for a move back through to $0.1230 levels.
An extended rally would test the resistance at $0.1250. The Third Major Resistance Level sits at $0.1274.
A fall through the First Major Resistance Level and the day’s $0.1196 pivot would test the First Major Support Level at $0.1175. Barring an extended sell-off, DOGE should steer clear of sub-$0.1170 levels. The Second Major Support Level sits at $0.1157.
Looking at the EMAs and the 4-hourly candlestick chart (below), it is a bullish signal. DOGE sits above the 100-day EMA, currently at $0.1199.
This morning, the 50-day EMA closed in on the 100-day and the 200-day. The 100-day EMA narrowed on the 200-day EMA, also positive.
A move through the 200-day EMA would support another run at $0.13.
SHIB Price Action
At the time of writing, SHIB was up by 3.09% to $0.00002367.
Technical Indicators
SHIB will need to hold above the First Major Resistance Level at $0.0000235 to take another run at the Second Major Resistance Level at $0.0000241. Support from the broader market would deliver a move through this morning’s high of $0.0000240.
An extended rally would test resistance at $0.0000245. The Third Major Resistance Level sits at $0.0000252.
A fall through the First Major Resistance Level and the day’s $0.0000229 pivot would bring the First Major Support Level at $0.0000224 into play.
Barring an extended sell-off, SHIB should steer clear of sub-$0.000022 levels. The Second Major Support Level sits at $0.0000218.
Looking at the EMAs and the 4-hourly candlestick chart (below), it is a bullish signal. SHIB sits well above the 100-day EMA at $0.0000231.
This morning, the 50-day EMA narrowed to the 100-day EMA, providing support. The 100-day EMA was flat on the 200-day EMA, however.
A move back through the 200-day EMA, currently at $0.0000241, would bring $0.000025 levels into play.
About the Author
Bob Masonauthor
With over 28 years of experience in the financial industry, Bob has worked with various global rating agencies and multinational banks. Currently he is covering currencies, commodities, alternative asset classes and global equities, focusing mostly on European and Asian markets.
Advertisement
