


Silver Recovers as Oil and Yields Pull Back
Silver caught a bid Friday after the rate trade that drove Thursday’s selling finally paused. Crude slipped back from triple digits, Treasury yields backed off their highs and short sellers who leaned into Thursday’s surge had less reason to stay aggressive. The bears had oil above $100, the 10-year yield at fresh highs and a firmer dollar all working for them Thursday and silver did not break. That failure is the reason the covering rally gained traction Friday once crude started pulling back. The FOMC meets next week and the weekend carries military risk that could send crude in either direction.
At 14:04 GMT, Spot Silver is trading $58.38, up $0.72 or +1.25%.
Silver Held Through the Worst of the Yield Surge
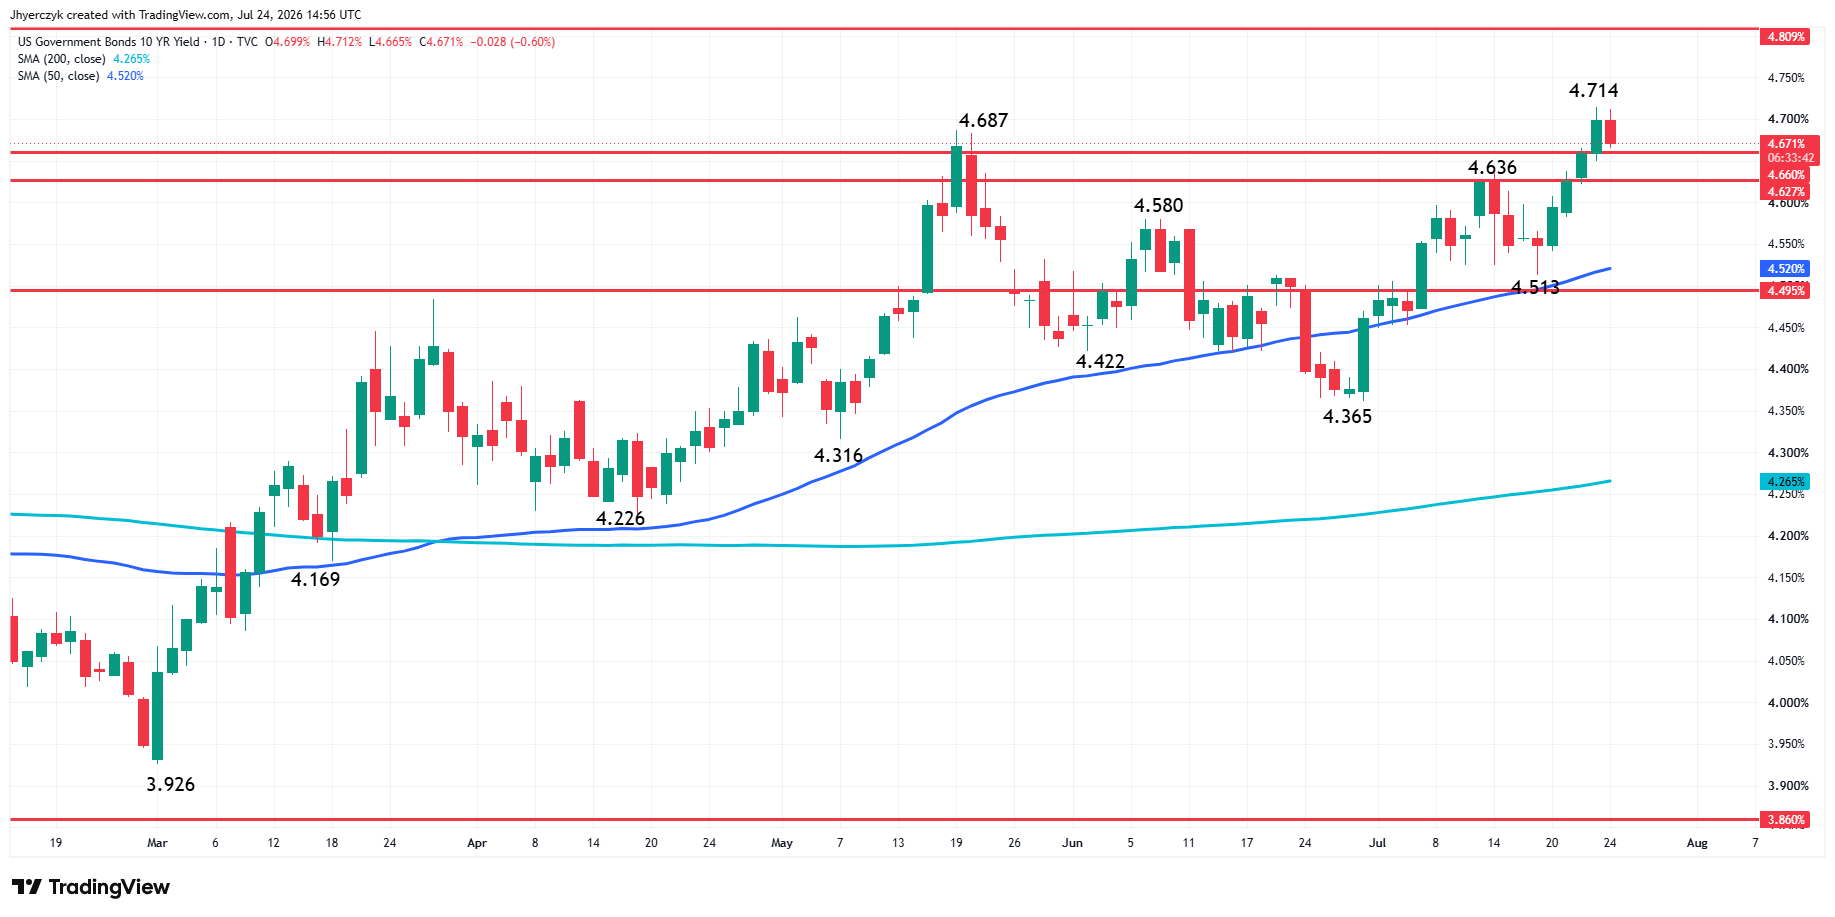
The 10-year yield hit near 4.71% Thursday, the 2-year pushed near 4.37% and crude crossed $100. Silver held together through all of it and then turned higher Friday when crude and yields backed off. The shorts who pressed into that setup expecting follow-through did not get it and some of those positions had to come off Friday morning.
The 10-year is trading closer to 4.68% Friday. That is still elevated but the direction changed and for a market that had been absorbing higher yields all week, a pause was enough to bring in buyers. Brent slipped below $100 as traders booked profits after the sharp weekly run and WTI eased with it. That took the edge off the inflation pressure and gave the Treasury selloff room to stall.
FOMC and Oil Keep the Ceiling Low
The covering rally does not change the rate picture. Fed funds futures are still pricing a meaningful chance of a hike at next week’s meeting even though a hold remains the most likely outcome. The probability of additional tightening through early 2027 is higher than it was before crude started running and Warsh does not have to raise rates to put pressure back on silver. A statement focused on elevated energy costs and sticky inflation does the same job because the bond market has already been doing the tightening work on its own.
Iran is still restricting Hormuz traffic. Saudi Red Sea routes are under pressure after Houthi attacks on tankers this week. Trump threatened a broader attack on Iran and a fresh escalation puts crude back in control fast. Friday’s pullback gave silver room but that room disappears if the next headline sends crude back toward triple digits and the yield trade reignites.
Silver Price Forecast
Every new Silver analysis as it publishes, today's technical signal and key levels, live price — on one page.
See all Silver forecastsSpot Silver (XAGUSD) Technical Analysis
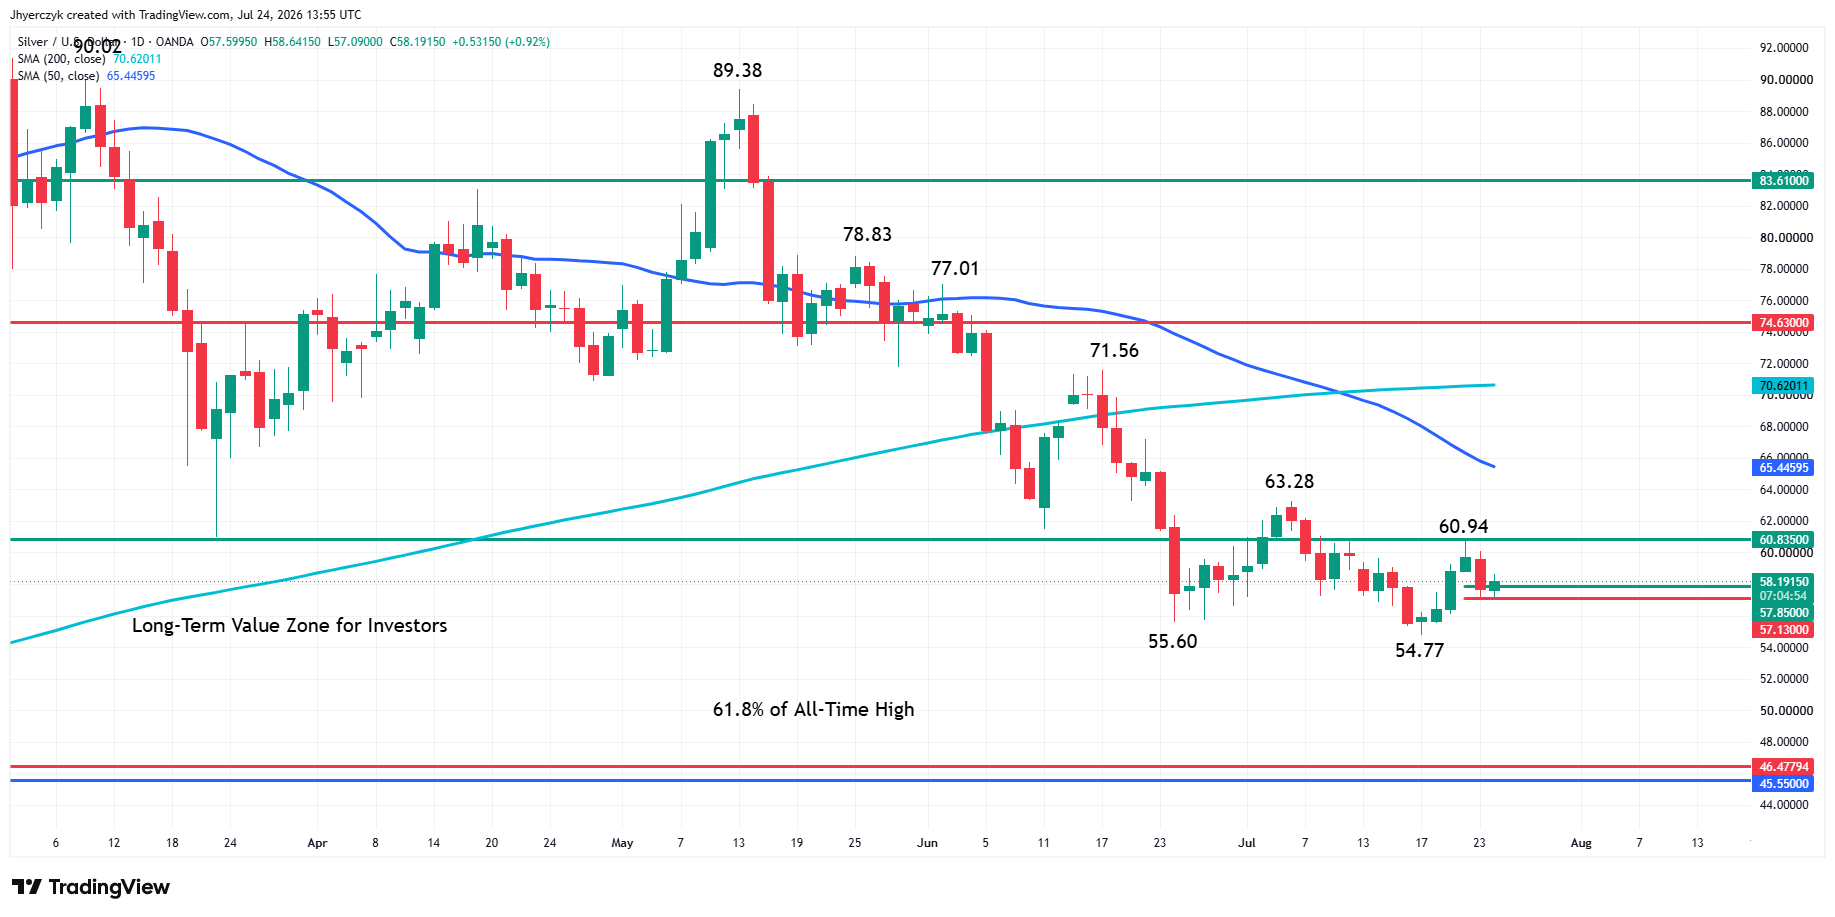
Spot silver is edging higher on Friday, but volume appears to be on the light side. The market is actually trading inside yesterday’s range, which suggests trader indecision and impending volatility.
Looking at the big picture, XAGUSD is trading inside a long-term retracement zone. 50% of the all-time high is $60.835 and 61.8% is $46.48. Some investors may view this as a value area.
The market is being capped by a minor top at $60.94, the long-term 50% level at $60.835 and a main top at $63.28. The 50-day moving average is $65.45 and the 200-day moving average comes in at $70.62.
On the downside, the short-term support is a swing bottom at $54.77.
This week, XAGUSD formed a minor range at $54.77 to $60.94. Its retracement zone is $57.85 to $57.13. This zone is being tested today. Counter-trend traders may be trying to form a secondary higher bottom, but trend traders want to keep the pressure on the market.
Given this assessment, I think that trader reaction to $57.85 to $57.13 will set the tone into the close on Friday.
What to Watch
Silver is higher because the selling pressure stalled, not because the rate outlook improved. Crude pulling back gave yields room to pause and shorts a reason to cover but that relief depends entirely on oil staying contained. Another escalation in the Middle East puts crude back near $100 and the inflation trade comes right back. If oil continues to ease and the FOMC holds without a hawkish surprise from Warsh, the covering has room to run into next week.
The market is trading inside yesterday’s range on light volume and sitting on the retracement zone that sets the tone into the close. Resistance is stacked above with the minor top, the long-term 50% level and the 50-day average all overhead. The swing bottom below is where sellers press if the rally fails. Friday’s close relative to the retracement zone tells you which side controls the direction heading into the FOMC meeting.
More Information in our Economic Calendar.