


Silver trades near $58.77 an ounce as I write this, with the gold-silver ratio around 69.5. That ratio is simply the number of silver ounces it takes to buy one ounce of gold, and investors watch it to judge whether silver is cheap or expensive against the larger metal. Silver is up roughly 50% from where it stood a year ago, and it still sits about 52% below the record of $121.62 set on January 29.
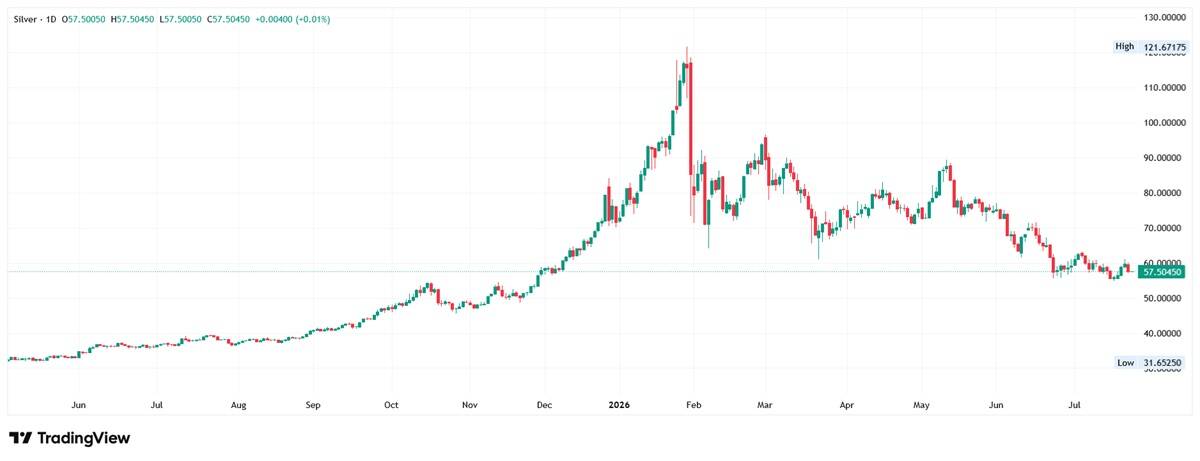
It would be easy to blame that gap on the war, and it would be wrong. The collapse from January’s record was a margin story, not a geopolitical one: exchange margin requirements on silver futures were raised, leveraged positions were forced out, and the price fell hard through early February, weeks before the first shot was fired. Silver had recovered into the $90s by the end of that month. What the war did was something different, and more instructive.
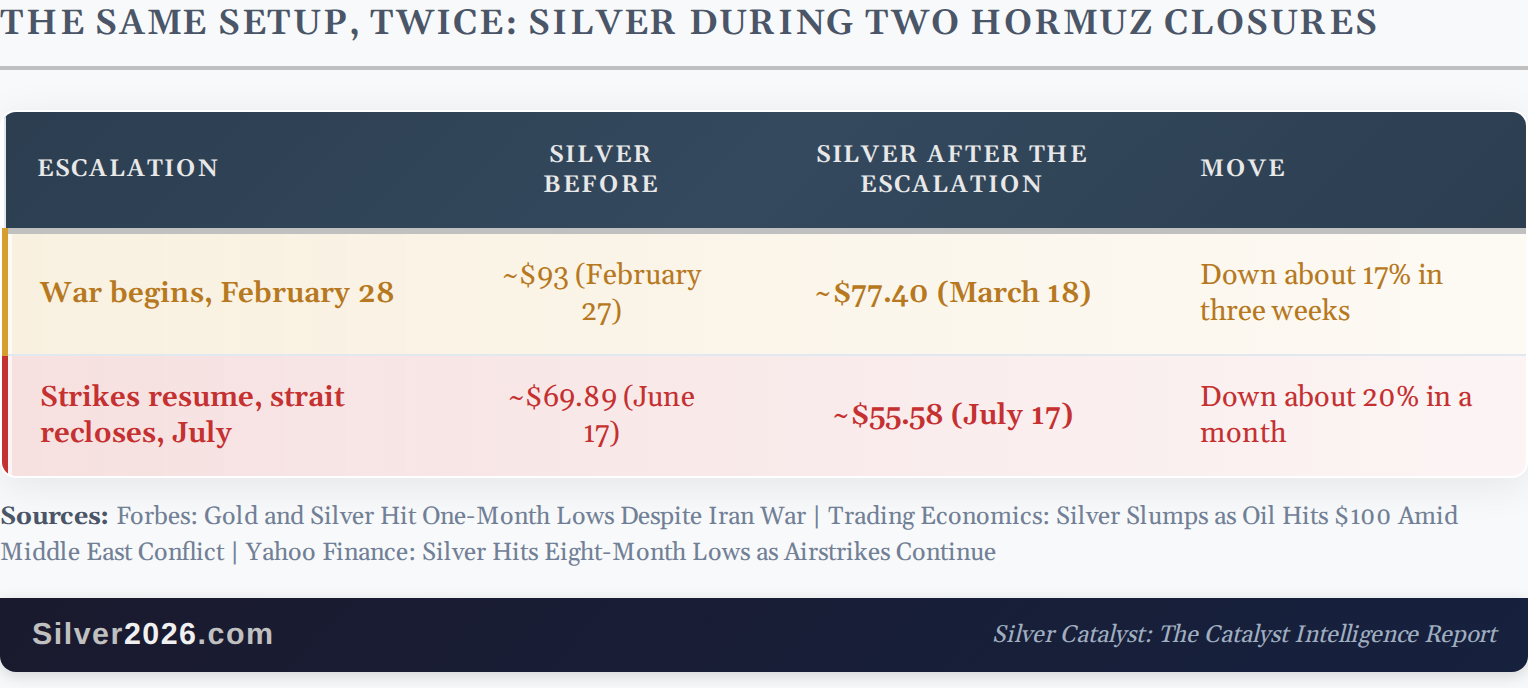
The striking thing about the past six months is that the same setup has now produced the same result twice. In late February, US and Israeli strikes on Iran shut the Strait of Hormuz and silver fell. In July, the strikes resumed, the strait closed again, and silver fell again. A single episode is an anomaly. Two is a pattern worth understanding, because it tells you which conditions turn geopolitical fear into higher silver prices, and which conditions do the opposite.
The Same Setup, Twice
The war began on February 28 with coordinated US and Israeli strikes on Iranian targets. Iran retaliated against shipping, and tanker traffic through the Strait of Hormuz effectively halted. Roughly one-fifth of the world’s oil passes through that waterway, so the closure went straight into energy prices. Brent crude climbed above $100 a barrel within about a week, the first time it had done so since 2022.
On paper, this was everything a precious metals investor is told to expect: a shooting war, a threatened oil supply, and a genuine inflation scare. Silver did jump briefly when markets opened. Then it gave the gain back the same day and kept sliding. By mid-March, both gold and silver sat at one-month lows, with silver near $77, falling despite the Iran war rather than because of it. The slide continued into the low $60s by late March.
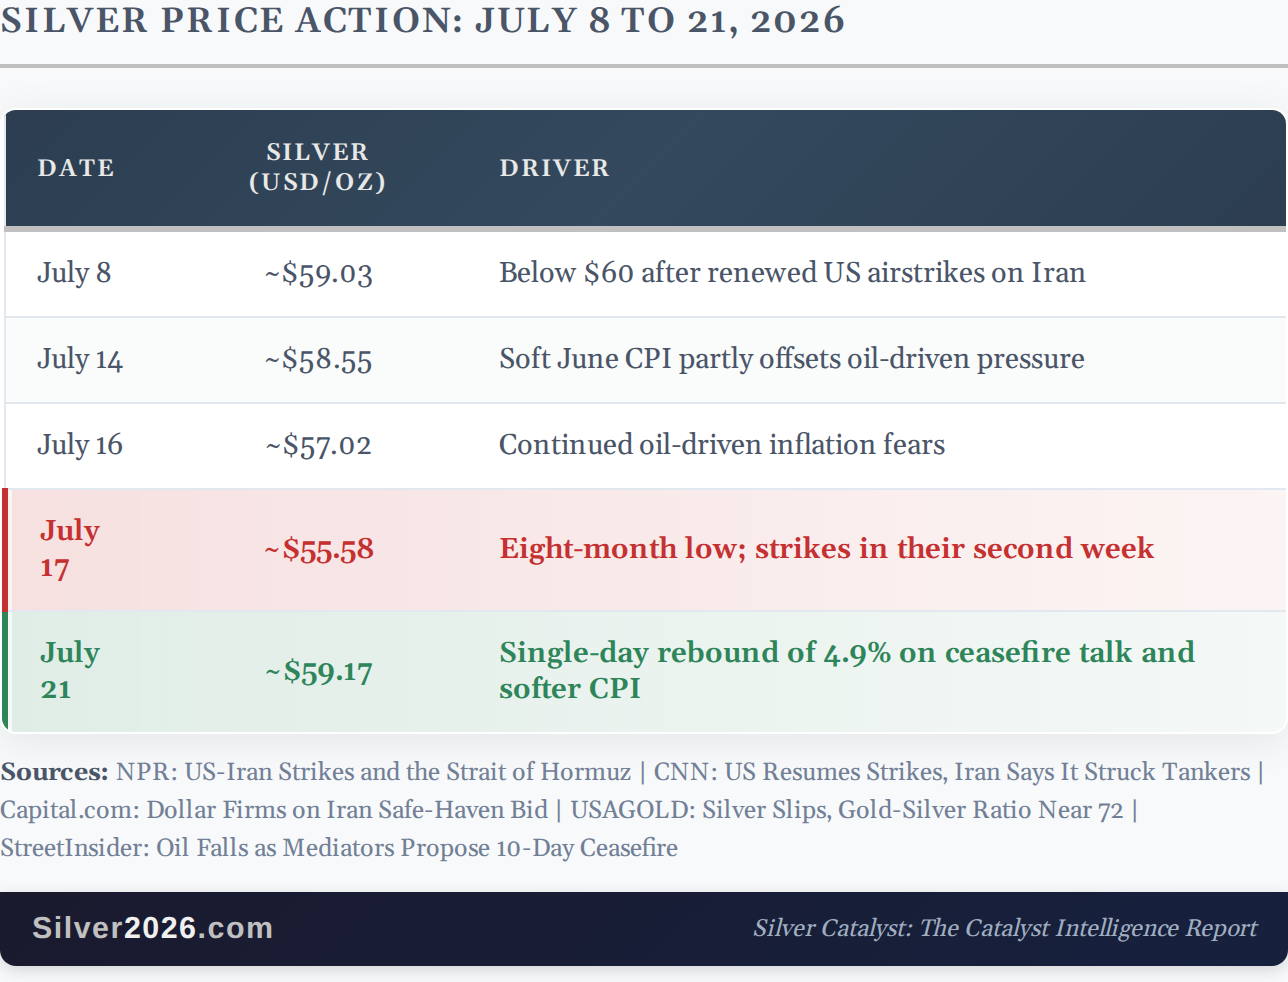
July ran the same sequence in miniature. A June ceasefire frayed, the United States notified Congress that military action had resumed, Iran struck tankers, and the strait closed once more. Oil surged more than 9%. Silver, which had traded near $69.89 a month earlier, bottomed near $55.58 on July 17, an eight-month low.
Why the Crisis Bid Skipped Silver
Both times, the money looking for safety went into the US dollar rather than into metals. The dollar held near its strongest level in more than a year through the July window, and a stronger dollar mechanically pressures silver, because silver is priced in dollars and a more valuable dollar buys more of everything.
Silver Price Forecast
Every new Silver analysis as it publishes, today's technical signal and key levels, live price — on one page.
See all Silver forecastsThe oil spike did the rest of the damage, through a chain that is worth following slowly. Higher energy prices lift expected inflation. Higher expected inflation pushes up expectations for interest rates, and in this case it did more than that: it turned an expected series of Federal Reserve rate cuts into an argument about rate hikes. That is a direct headwind for silver, which pays no interest to whoever holds it. When investors believe cash and bonds will pay more, an asset yielding nothing looks worse by comparison.
Gold fell in both episodes too. Silver simply fell further, because industrial uses account for about 57% of total silver demand, so a shock that raises the cost of energy and threatens growth hits silver from two directions at once. That is why the gold-silver ratio widened toward 72 at the July low before compressing again on the rebound.
It is worth being precise about what did not happen. Iran produces a negligible amount of silver, so neither episode touched mine supply. The entire effect ran through investment demand.
Then, in July, it reversed quickly. Reports of a possible 10-day truce arrived alongside a softer June inflation reading, the expected-rate path eased, and silver rebounded 4.9% in a single session on July 21 to close the window near $59.17, almost exactly where it began.
What This Means to Silver Investors
The lesson is not that silver failed as a safe haven. The lesson is that the safe-haven response is conditional, and the conditions are knowable in advance.
Silver tends to benefit from a crisis when two things line up: the money fleeing to safety actually flows into metals, and the crisis pushes interest rate expectations down rather than up. When both hold, silver often outruns gold, because it is a much smaller market and the same inflow moves it further.
The clearest recent example is 2020. When the pandemic panic hit in March of that year, silver was sold hard alongside everything else, and the gold-silver ratio spiked to 127, meaning it took 127 ounces of silver to buy one ounce of gold. That was the liquidation phase, and it looked a great deal like this year. What changed was the policy response. Central banks cut rates to near zero and flooded markets with liquidity, and the safe-haven money that had been hiding in cash moved into metals. From its March low, silver rallied over 140% by early August 2020, and the ratio compressed from 127 to 72. The Silver Institute attributed the move to safe-haven demand, inflation fears, very low interest rates, and central bank liquidity. In July 2020 alone silver gained 34%, its best month since 1979.
Set that against 2026 and the contrast is direct. In 2020 the crisis drove rates to zero and the money went into metals. In 2026 the crisis ran through oil, so it drove rate expectations up and the money went into the dollar. Same asset, opposite configuration, opposite outcome.
Two practical implications follow. First, watch where the safe-haven money is actually going, not merely whether fear is rising. A climbing dollar during a crisis is a warning sign for silver in the short run. Second, energy-driven crises and financial-system crises are not the same trade. A banking scare that pulls rate expectations down is a very different setup for silver than an oil shock that pushes them up.
None of this touched the physical picture underneath. Mine supply was unaffected in both episodes, and the market is still forecast to run a sixth consecutive annual deficit of 46.3 million ounces in 2026, according to Metals Focus and the Silver Institute. Those are separate clocks. The macro channel can dominate for weeks at a time, as it plainly did twice this year, while the supply and demand balance moves on a horizon measured in years.
That distinction is the practical value of watching this closely. If you follow how silver has traded in 2026, you will notice the sharpest moves have come from the macro channel, while the longer-term case for silver has rested on the structural shortfall that keeps drawing down above-ground stocks. Confusing one for the other is how investors talk themselves out of a position during exactly the sort of fortnight we just had, and it is also why the framework in Silver Rising treats the safe-haven response as a conditional catalyst rather than an automatic one.
The honest summary is that silver has now run the unfavorable configuration twice this year, and in July it still finished roughly where it started.
The safe-haven question is one dimension of the 100-catalyst framework I analyze in Silver Rising, alongside the five other Deep Dives in this issue of the Silver Catalyst newsletter. Get full Silver Catalyst Newsletter and Silver Rising book today.
Thank you.
The Silver Engineer