Earnings Spark a Bullish Breakout
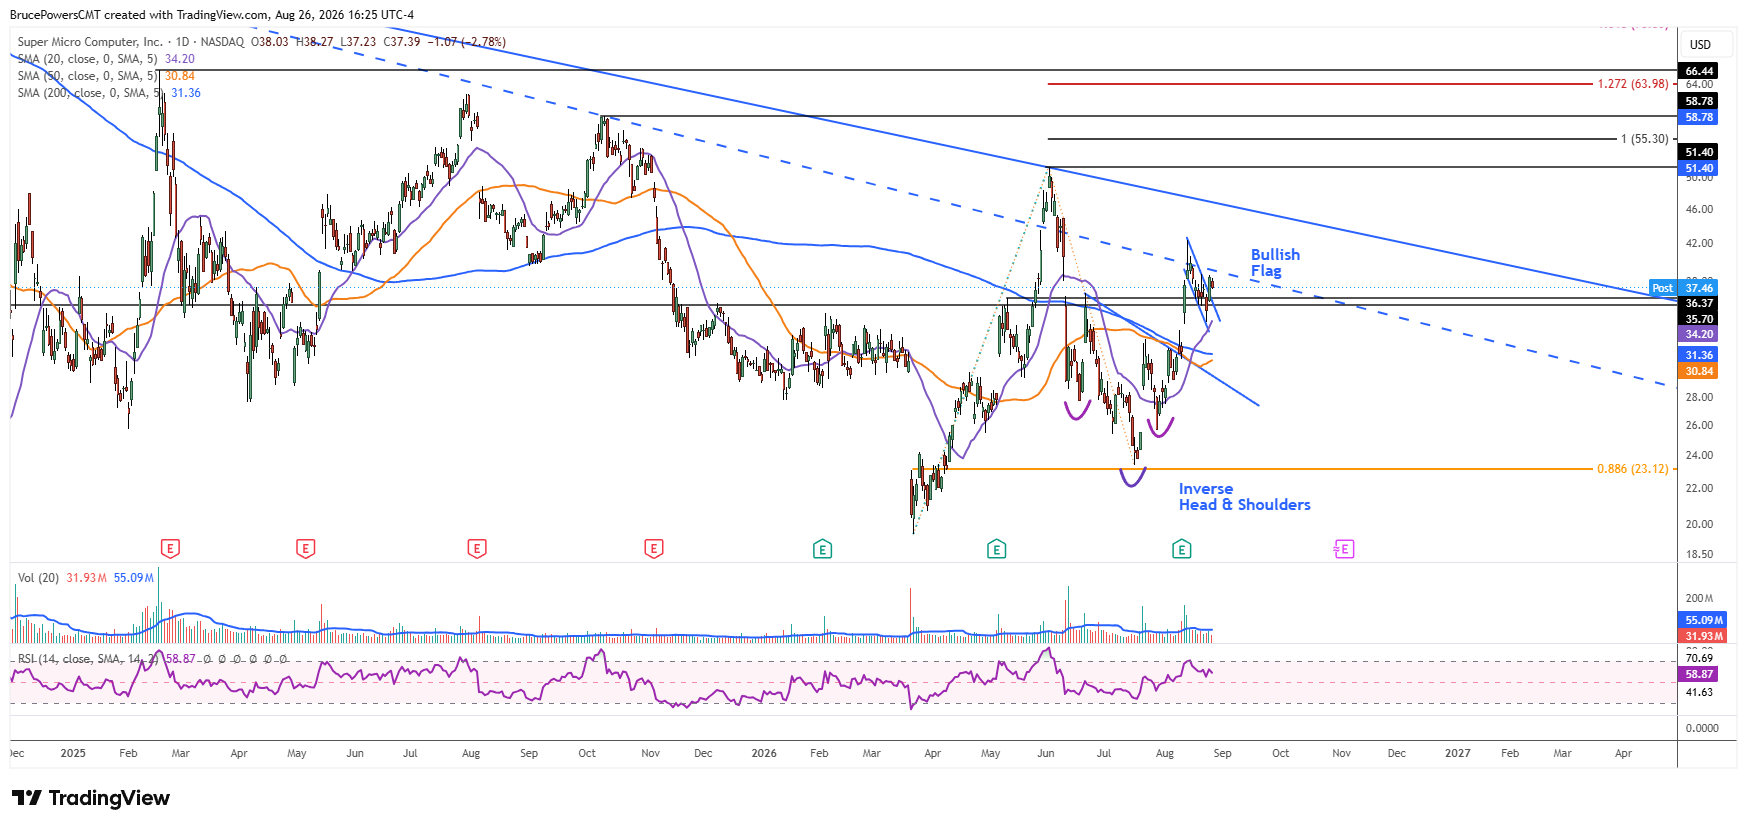
Shares of Super Micro Computer, Inc. (SMCI), an AI-server and data-center equipment manufacturer, confirmed the bullish breakout of an inverse head-and-shoulders pattern on August 12. The sharp gap higher and rally followed its Q4 fiscal 2026 earnings report released after the market closed the night before. An initial high of $42.31 was reached during the advance, followed by a pullback and a higher swing low of $34.09 established on Monday. That low was a successful test of support near the rising 20-day moving average, providing another sign of strengthening.

$51.40 Becomes a Key Test
The first pullback since the breakout of the inverse head-and-shoulders took the form of a relatively narrow bullish flag, with an initial breakout signal triggering on Tuesday. If the bullish implications of the flag pattern are retained, another leg higher may be beginning. That could lead to a recovery of the recent lower swing high of $51.40, which would provide a continuation signal for a rising ABCD pattern and a reversal signal for the prior downtrend structure. In other words, a move above $51.40 would strengthen the case that the recent recovery is becoming more than a short-term rebound.
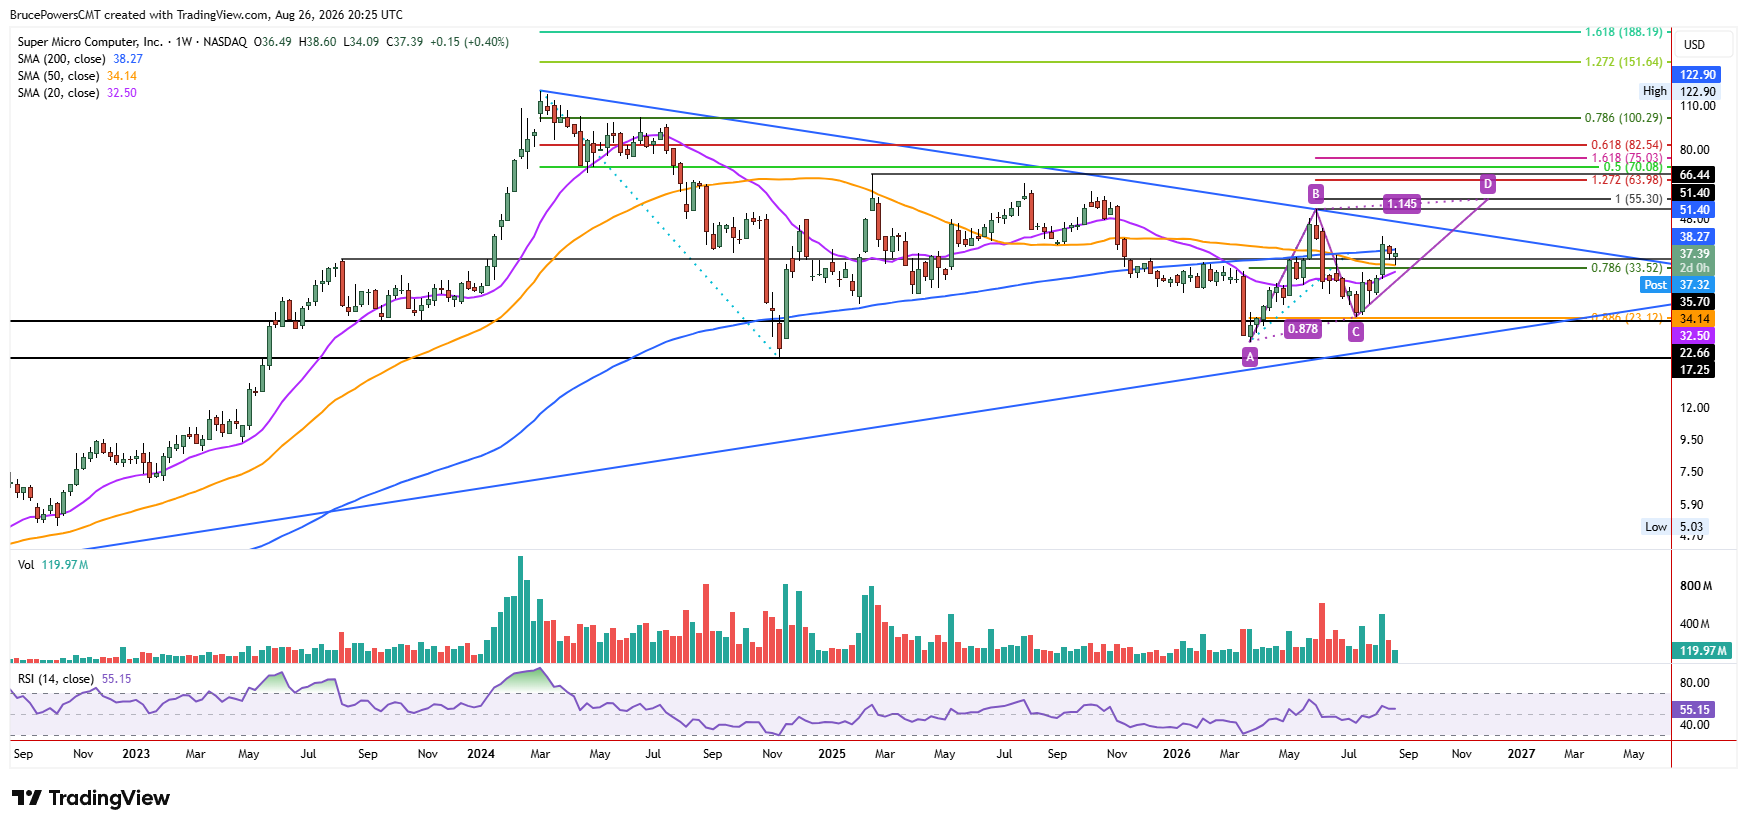
Nonetheless, a sustained recovery above $51.40 would also confirm a breakout above the long-term downtrend line that has defined the full bearish correction following the 2024 peak of $122.90. Two bullish patterns have followed the March correction low of $19.48, showing that buyers are regaining control. The recent pattern breakouts also support the potential completion of the long-term bearish correction. Once complete, the long-term bull trend could be positioned to reassert itself more clearly. For now, $51.40 remains an important level for confirming that transition.
$55.30 Offers an Initial Pattern Target
The dominant pattern developing looks to be a rising ABCD pattern that begins from the March low. On the weekly chart, the pattern projects an initial 100% target near $55.30. That is where the advance seen in the second leg up, starting with point C, will match the price change in the first leg up. Once that occurs, a potential pivot level is indicated.
Since that initial upside target from the developing pattern is above the June swing high, it may have a somewhat greater chance of being recovered. The recent flag breakout therefore provides a near-term catalyst, while a move above $51.40 would offer stronger confirmation of the larger bullish reversal. Together, those developments could determine whether SMCI can extend its recovery toward the $55.30 objective and further challenge the long-term bearish structure that began at $122.90.