E-mini S&P 500 futures edge higher as traders eye the 200-day MA. Oil above $100 and U.S.-Iran tensions drive sentiment while investors await the Fed decision this week.
The major U.S. stock index futures are slightly higher early Sunday as investors try to rebound from another weekly loss. Dow futures are up about 0.3%, while S&P 500 and Nasdaq-100 futures are moving about 0.3% higher.
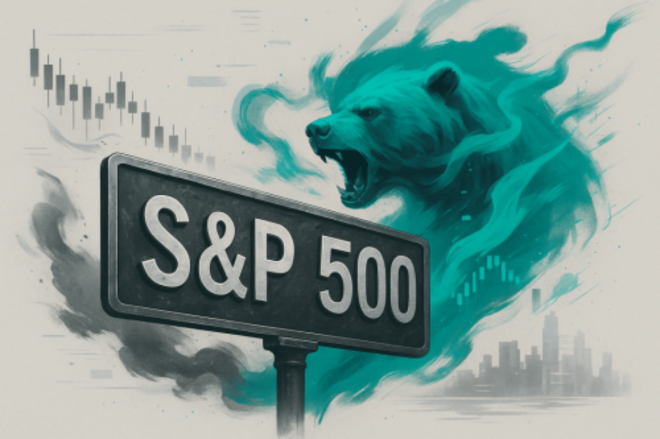
Last week, the benchmark S&P 500 recorded its third straight weekly loss and finished at its lowest level of the year. For the week, the S&P 500 dropped about 1.6%, while the Dow fell around 2% and the Nasdaq declined roughly 1.3%.
A major factor influencing the U.S. stock market right now is the jump in oil prices tied to the war between the United States and Iran. Oil rallied sharply last week after shipping traffic through the Strait of Hormuz, one of the most important oil routes, was disrupted by the fighting. This week, stock market investors will likely be reacting to crude oil’s reaction to the $100 level.
Investors will also be looking for signs of a slowdown in attacks by both sides, or an escalation of the war. I’m leaning toward an escalation because of President Trump’s ordered strikes on Iranian military assets on Kharg Island and the U.S. still hasn’t come up with a plan to escort ships through the Strait of Hormuz.
Investors will also be tuned into Treasury yields, which rose last week. This week, the Fed is expected to leave interest rates unchanged at its meeting on Wednesday.
E-mini S&P 500 Index futures are edging higher as buyers came in at 6608.50, defending the March 9 bottom at 6584.50 and the November 21 bottom at 6583.00. Despite the slight rebound, the market is still facing a major headwind in the form of the 200-day moving average at 6699.50. This indicator should set the tone on Monday.
A sustained move over the 200-day MA will signal the return of buyers. If this creates enough upside momentum, we could see a drive into the short-term retracement zone at 6784.25 to 6831.25. The test of this zone will determine if traders are in “sell the rally” mode. If this zone stops the rally then look for a pullback to the 200-day MA.
Taking out 6831.25 will indicate the buying is getting stronger. A move through 6852.00 will change the minor trend to up and shift the momentum to the upside. This could lead to a quick test of the 50-day moving average at 6902.50.
To recap the importance of the 200-day moving average, a strong rally through it could mean a test of 6784.25 to 6831.25 today. While the failure to overcome it, sets up the possibility of a steep break under 6583.00.
More Information in our Economic Calendar.
James Hyerczyk is a U.S. based seasoned technical analyst and educator with over 40 years of experience in market analysis and trading, specializing in chart patterns and price movement. He is the author of two books on technical analysis and has a background in both futures and stock markets.