
Solana-based Official Trump (TRUMP) memecoin is attempting to extend its sharp rebound after surging roughly 50–60% in the past two days, with technical charts now pointing to the possibility of a 30% upside move toward the $5 area.

Event-Driven Hype Fuels ‘Buy TRUMP’ Narrative
The TRUMP rally began after the project announced an exclusive “Fight Fight Fight” Crypto & Business Conference scheduled for April 25, at US President Donald Trump’s Mar-a-Lago resort in Florida.
The event will include a private gala luncheon and potential keynote access to Trump himself.
The promotion quickly triggered a buying frenzy. Roughly the top 297 holders based on time-weighted balances between March 12 and April 10 will receive invitations to the event.
The structure created immediate FOMO among traders, who rushed to accumulate the token in an attempt to climb the leaderboard and secure access.
my OTC deal for $500k worth of $TRUMP just got filled…
will come back to this post in 24 hours
may GOD be with me. pic.twitter.com/EZi4fS1ilq
— Laanie (@cryptolaanie) March 13, 2026
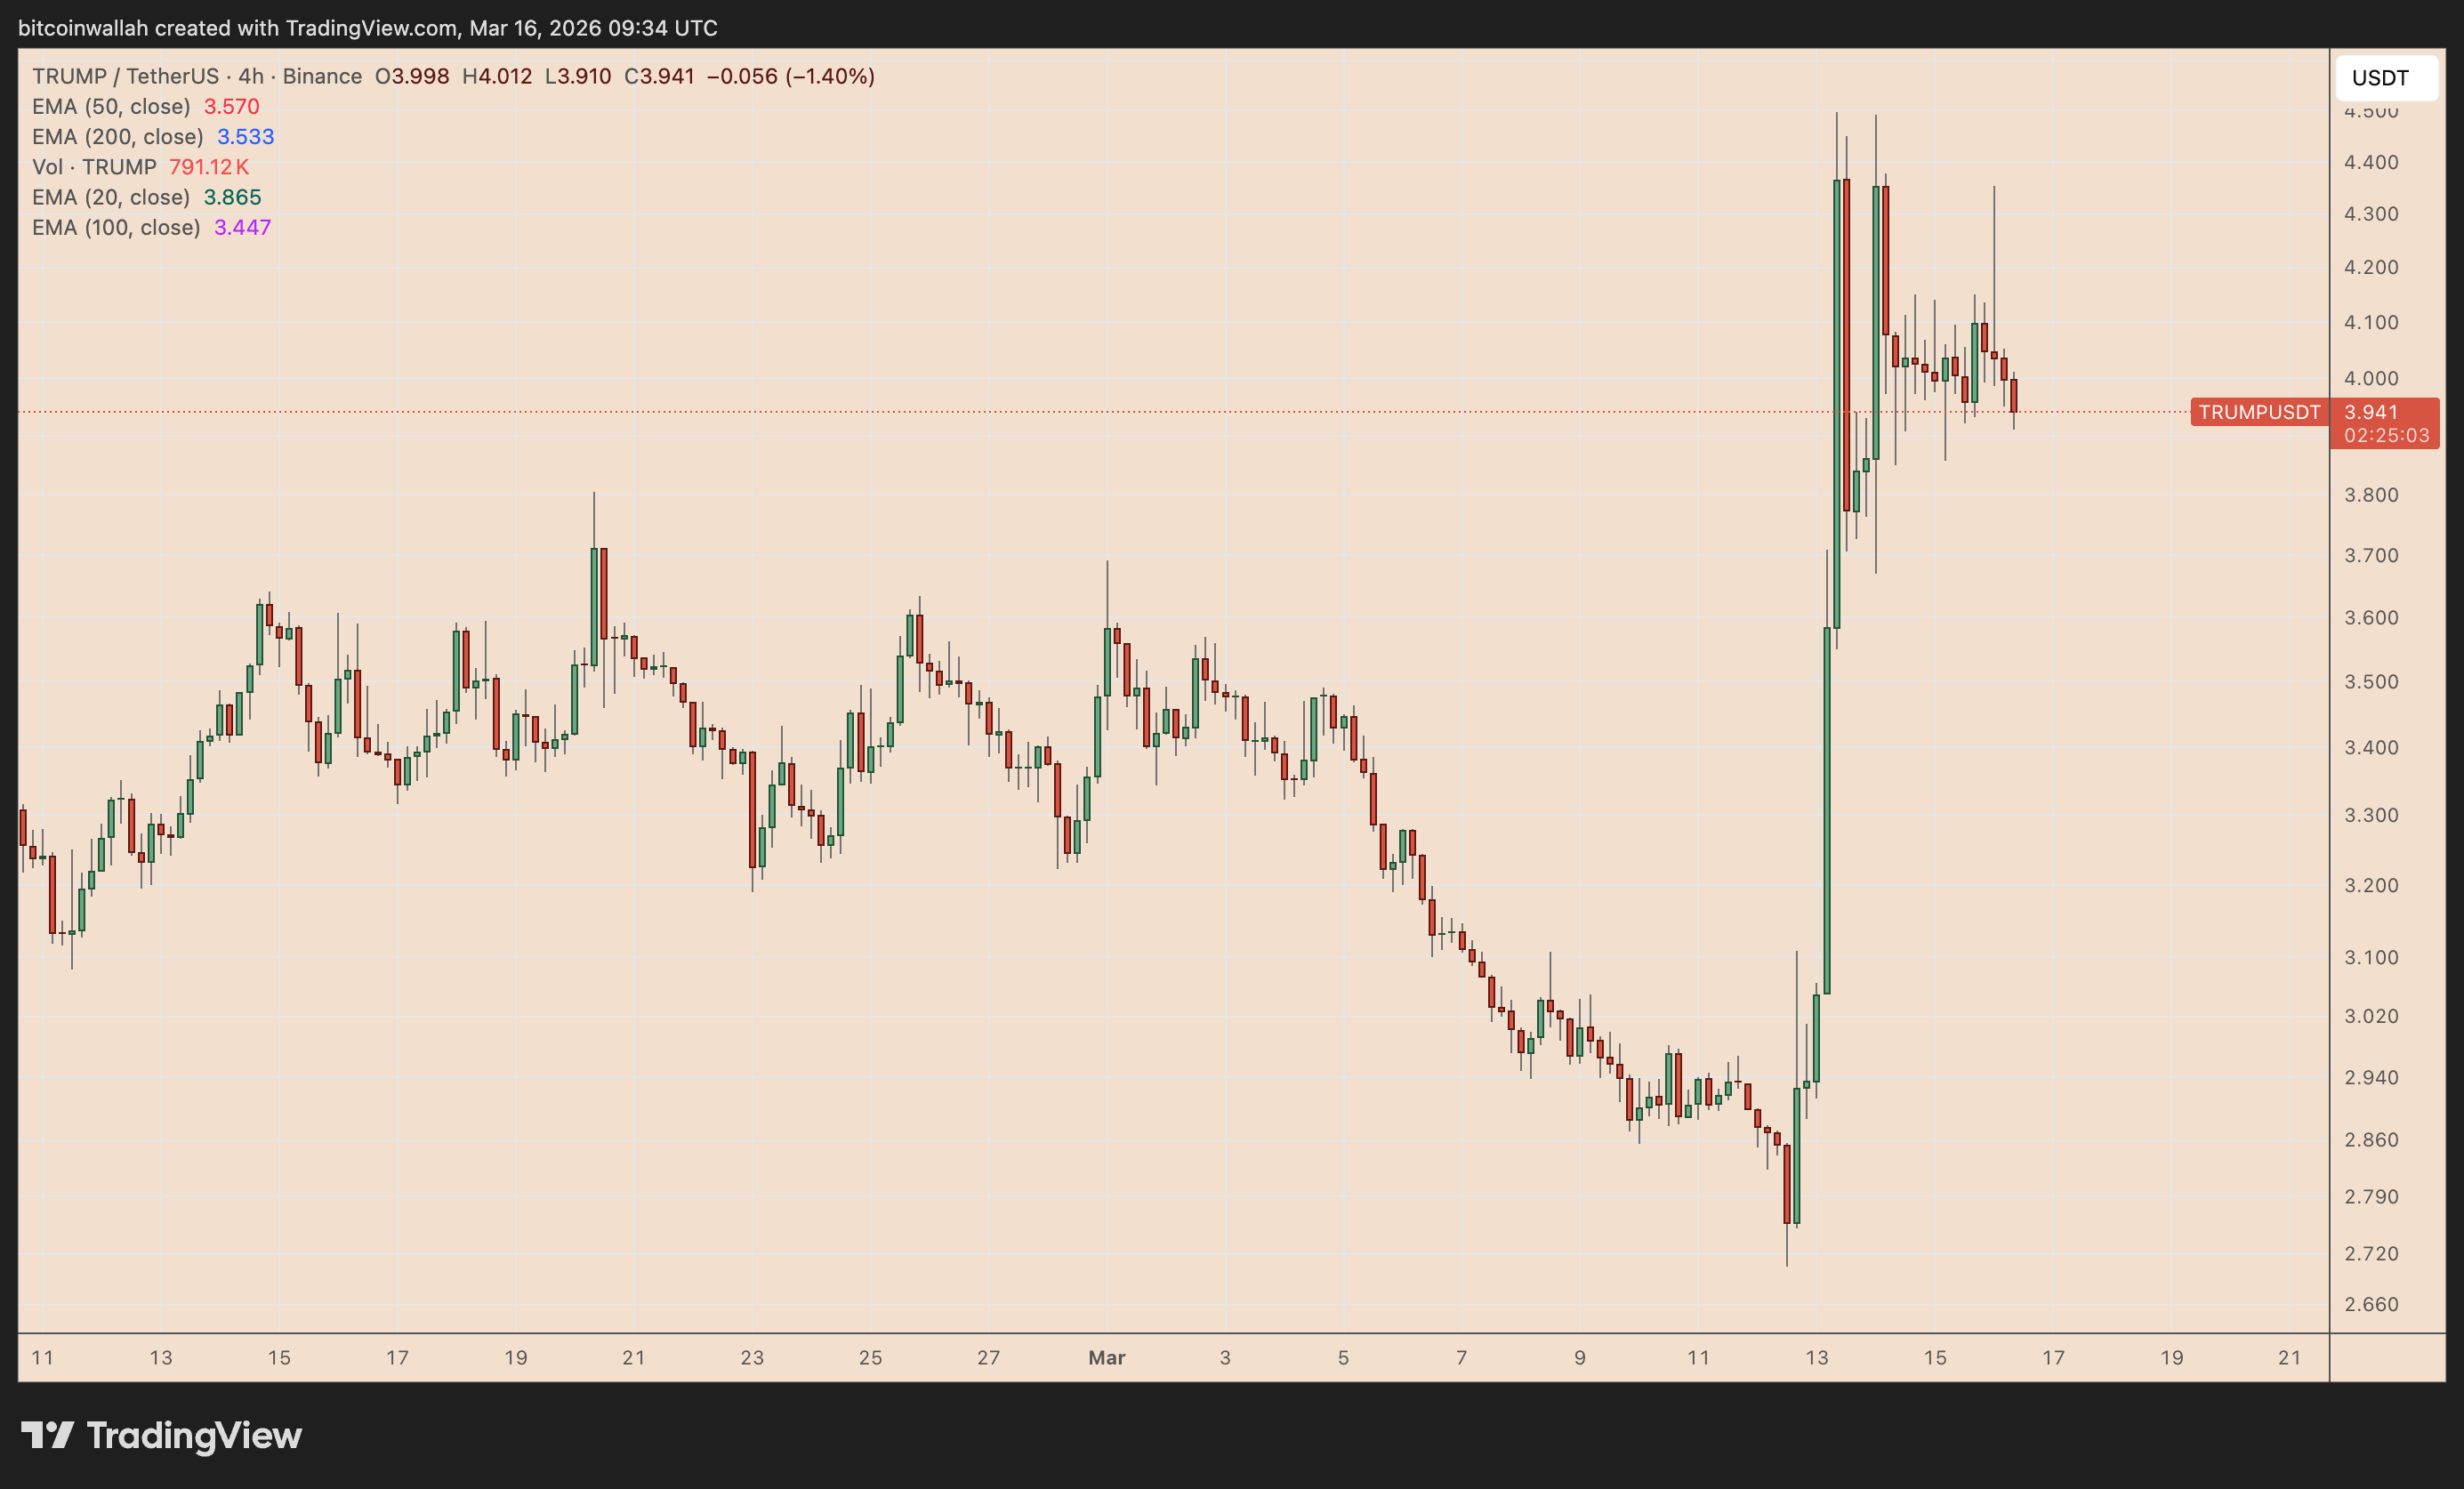
That surge in demand pushed 24-hour trading volume above $1.6 billion at its peak, while derivatives markets also saw a sharp increase in open interest. TRUMP briefly broke above the $4 level before consolidating around the $3.80–$4.00 range.
The price action mirrors a similar promotional strategy used last year, when a dinner-style event announcement briefly fueled a rapid but short-lived rally in the token.
The White House has not officially confirmed Trump’s attendance at the upcoming event, meaning much of the rally is based purely on narrative and promotional hype rather than fundamental developments.
For now, TRUMP’s surge appears to reflect a familiar memecoin formula: scarcity, access, and social narrative driving rapid speculative demand.
Solana Price Forecast
Every new Solana analysis as it publishes, today's technical signal and key levels, live price — on one page.
See all Solana forecastsAscending Triangle Points to $5 Breakout
From a technical perspective, TRUMP is now forming an ascending triangle pattern on the 4-hour chart, a structure often associated with bullish continuation.
The pattern develops when buyers step in at progressively higher lows, while sellers repeatedly defend a flat resistance level.
In TRUMP’s case, the horizontal ceiling appears near the $4.30–$4.35 range, while a rising support trendline from the March 13 low shows steadily improving demand during pullbacks.
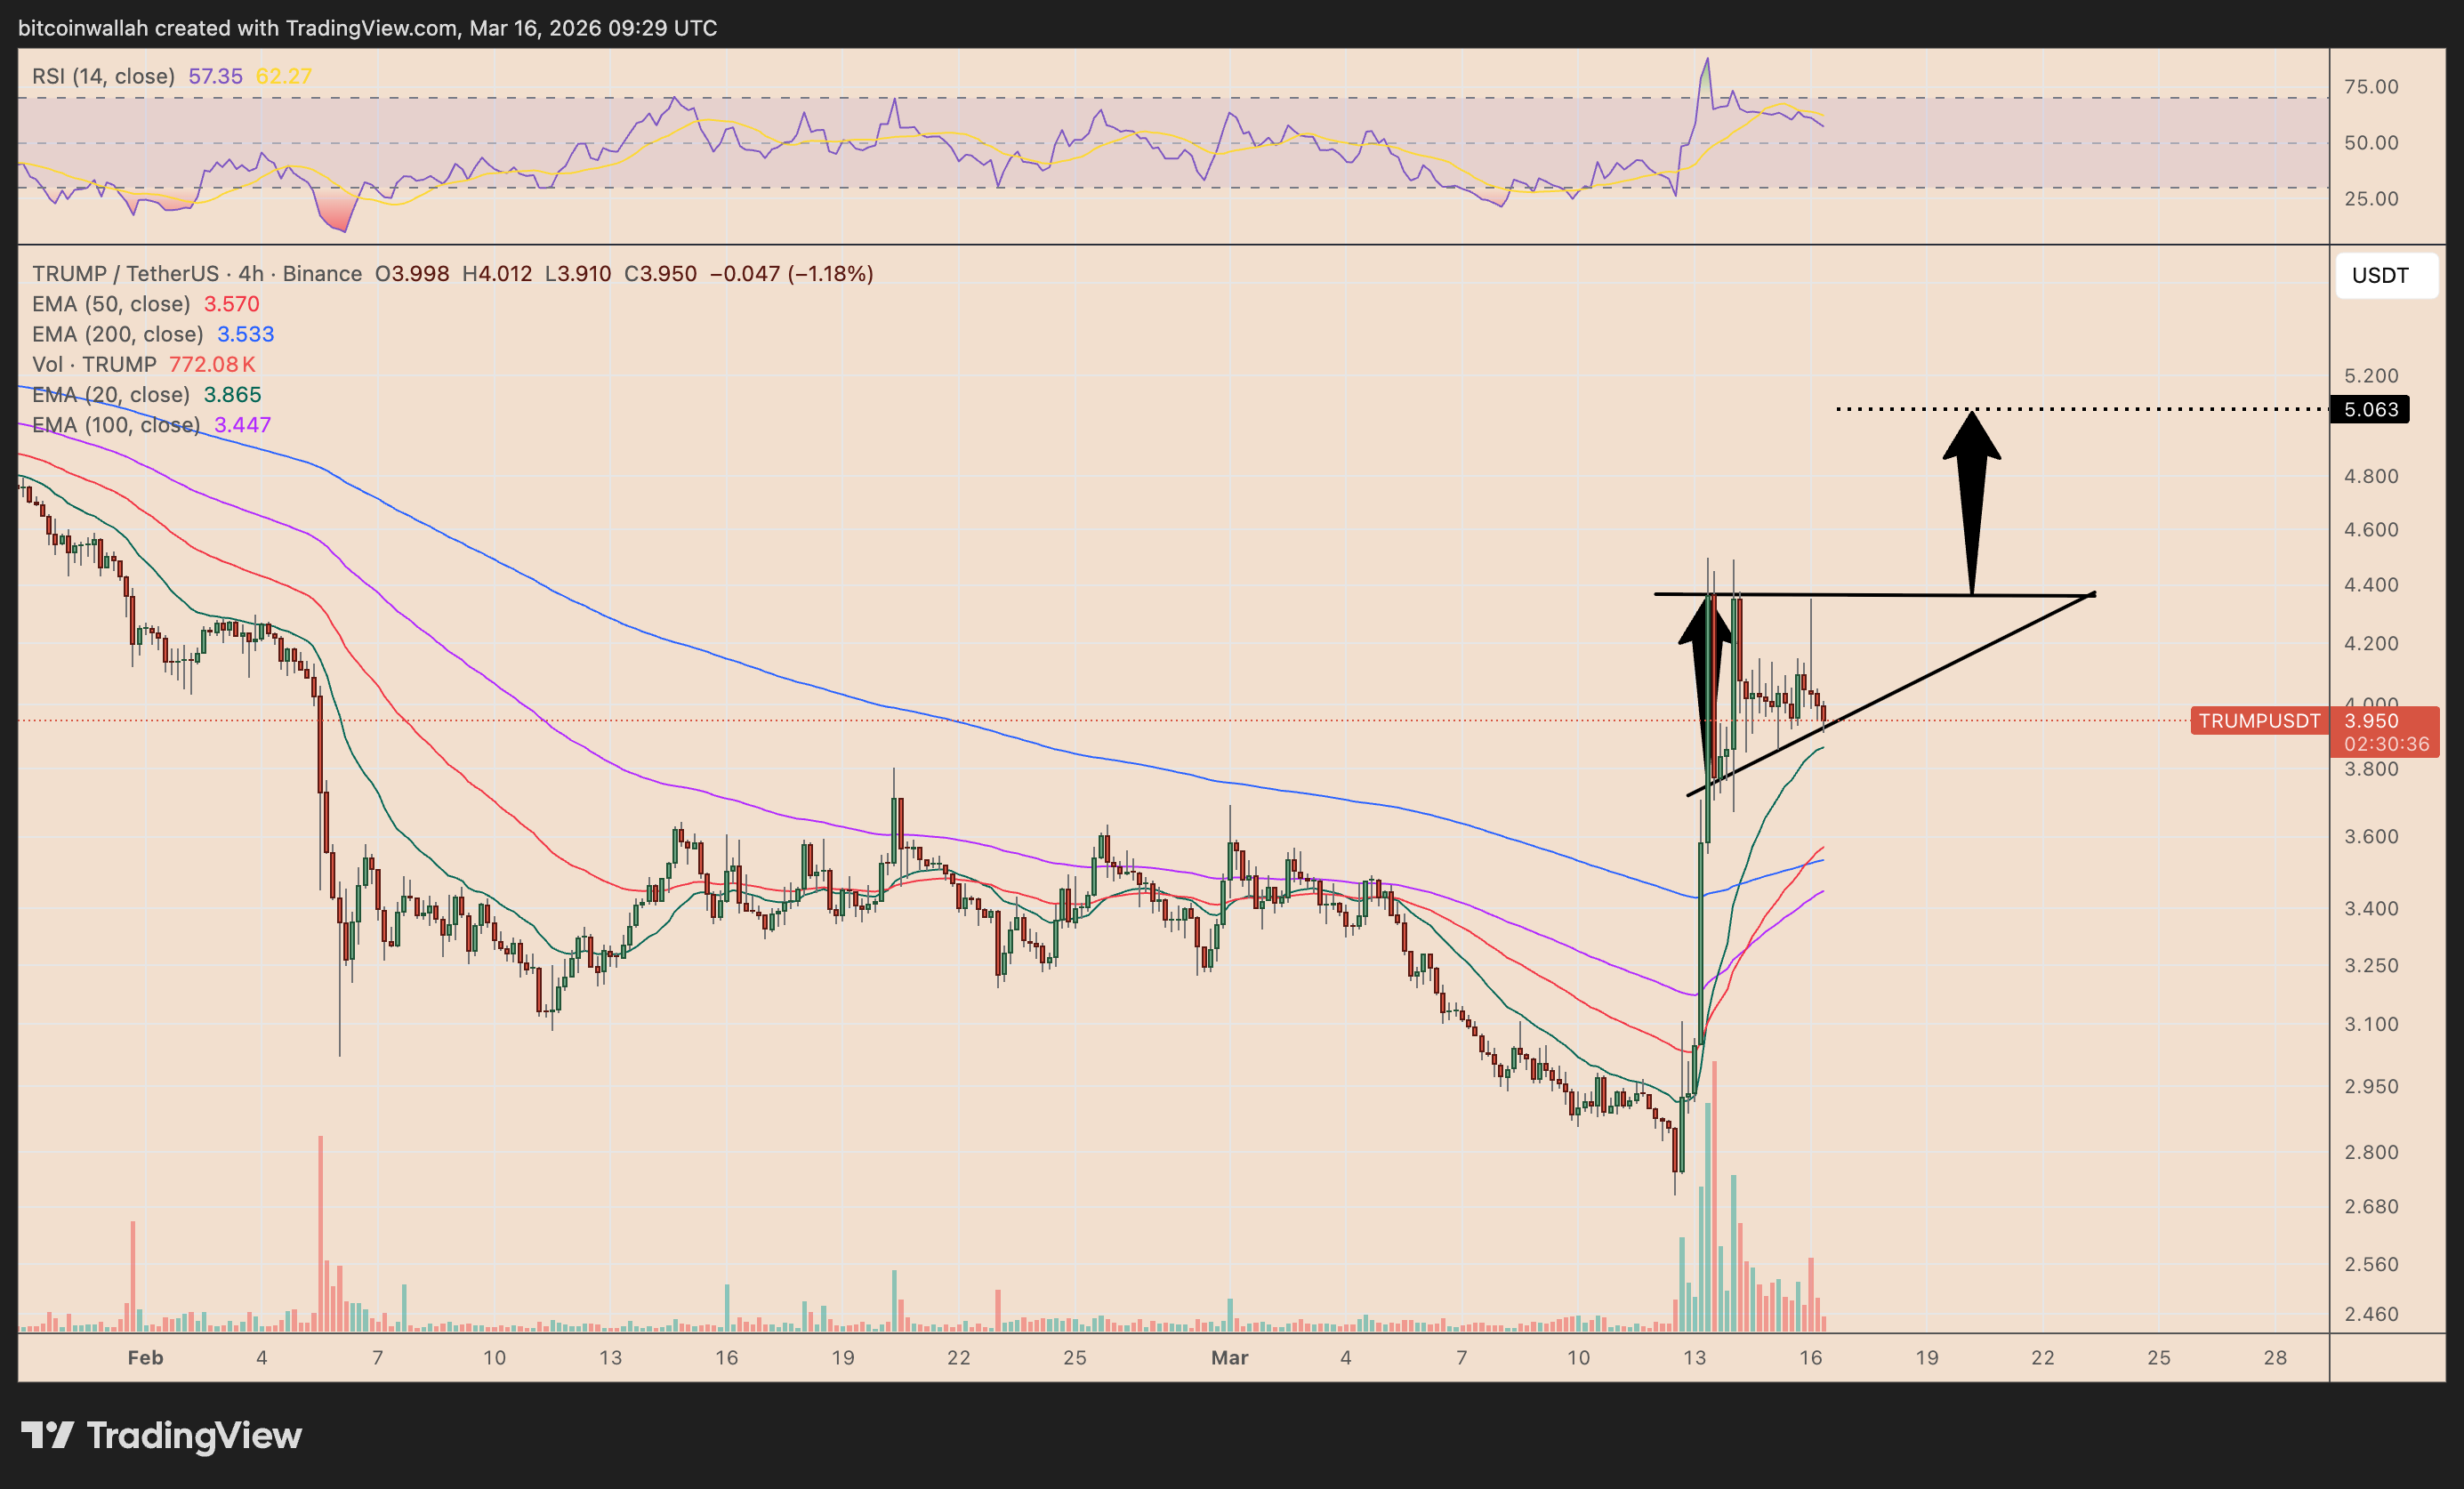
The token is currently consolidating just below resistance following the event-driven spike, suggesting bulls are attempting to absorb overhead supply rather than immediately take profits.
If TRUMP confirms a breakout above the $4.30–$4.35 resistance zone, the measured move from the triangle structure points to a potential target near $5.05, representing roughly 30% upside from current levels.