
The Supreme Court’s decision against Trump’s sweeping tariff policy has made tariff refunds a key factor in U.S. business and currency markets. The refunds reduce pressure for importers, retailers and households but the overall economy is still under stress. This creates a difficult environment for the Federal Reserve and a mixed outlook for the U.S. dollar. This article presents the impact of tariff refunds, weak economic data and inflation threat on USDJPY, EURUSD and GBPUSD.

Trump Tariff Refunds Ease Cost Pressure on U.S. Businesses
The Trump administration has already paid about $20 billion in tariff refunds. The additional $65 billion is expected to be added. The refunds are part of a decision by the Supreme Court to invalidate Trump’s broad tariffs. The decision was welcomed by importers who had been struggling with increases in costs and uncertainty over policy for months.
Many US Businesses welcomed the decision. The tariffs had been increasing the costs for retailers, shippers, manufacturers and trade groups. Walmart (WMT) and General Motors (GM) submitted refund requests. FedEx Corporation (FDX) also sued the government for refunds of tariffs. It is clear that the ruling has become a direct monetary concern of big U.S. businesses.
The refunds may help to relieve price pressure for some of the companies or improve margins. Walmart said that it may cut the prices for customers by refunding part of the tariffs on the goods. This is important to note because the tariff charges were already borne by households. According to calculations by the Tax Foundation, the tariffs would raise the costs to the average household by about $1,000 in 2025 and they are costing the average household about $700 this year. Refunds can help alleviate some of the strain but will not completely take away the effects of increased import prices.
Weak U.S. Growth and Sticky Inflation Complicate Fed Outlook
The economic environment is still fragile. The real GDP growth slowed to annualized rate of 1.6%. An inventory buildup and front loading before tariffs also distorted growth in 2025. That makes the headline growth figures seem higher than the actual demand figures. The slowdown now indicates that the economy could be losing steam.
EUR/USD Price Forecast
Every new EUR/USD analysis as it publishes, today's technical signal and key levels, live price — on one page.
See all EUR/USD forecasts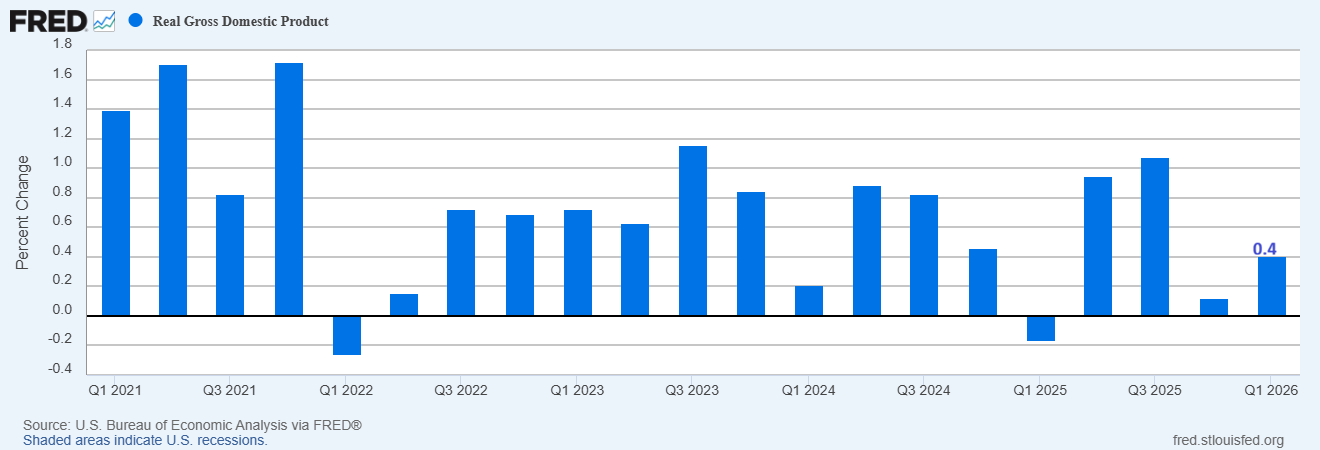
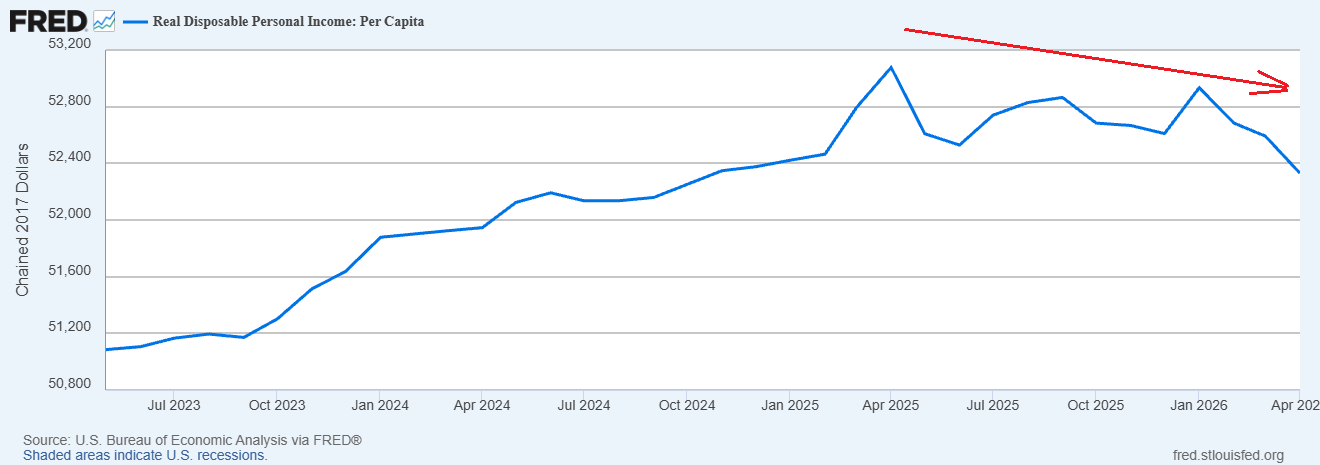
The chart below shows that the real disposable personal income per capita has been declining since April 2025. This indicates that inflation adjusted consumer income is weakening. This drop adds further pressure to household spending.
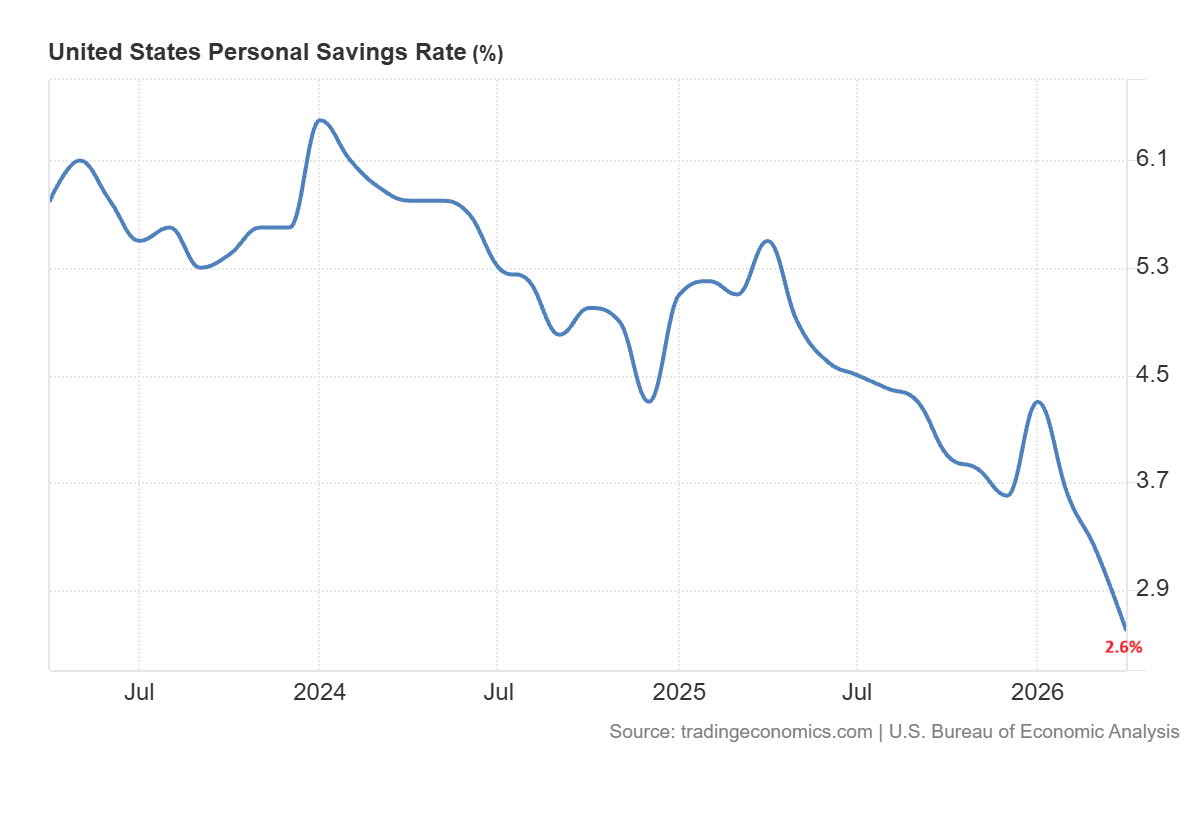
The saving rate has declined in the private sector. Consumers can either save or take on debt to keep spending. This kind of dip in personal savings below 5% came before recessions in 1999-2000 and 2005-2008. That does not guarantee a recession but it suggests that there is growing strain on household balance sheets.
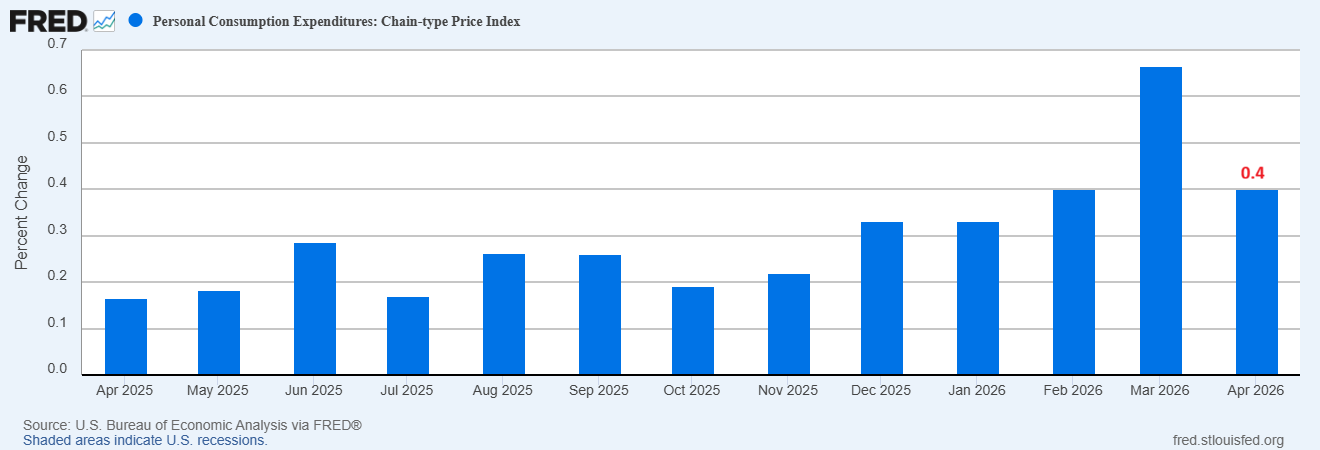
There is another issue with inflation. The PCE inflation index jumped to 3.8% in the 12 months to April.
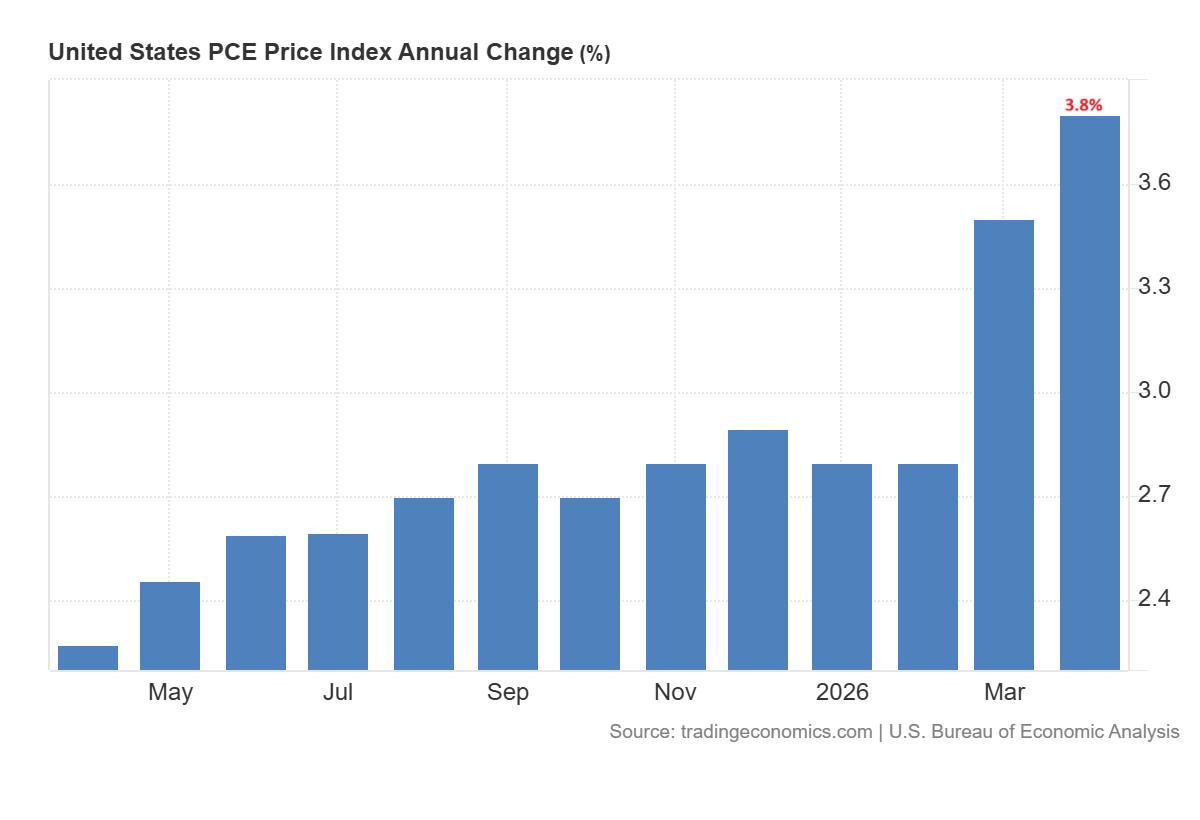
The 0.40% gain in the PCE for the month indicates annualized growth of 4.8%. Fuel prices remain the major risk as energy costs take time to move through the rest of the economy. It is a challenging environment for the Fed. The slowdown in growth suggests that policy should be easier while persistently high inflation limits the Fed’s ability to cut rates.
Impact on US Dollar: Tariff Relief and Inflation Shape Major Currency Pairs
The tariff pressure may reduce some pressure for US companies but the bigger picture of economic data still points to cooling growth and persistent inflation. This suggests a complex picture for the U.S. dollar. If the Fed continues to be tight on policy, the US dollar could see some support. But it may weaken if markets begin to price the weaker U.S. growth and lower rates.
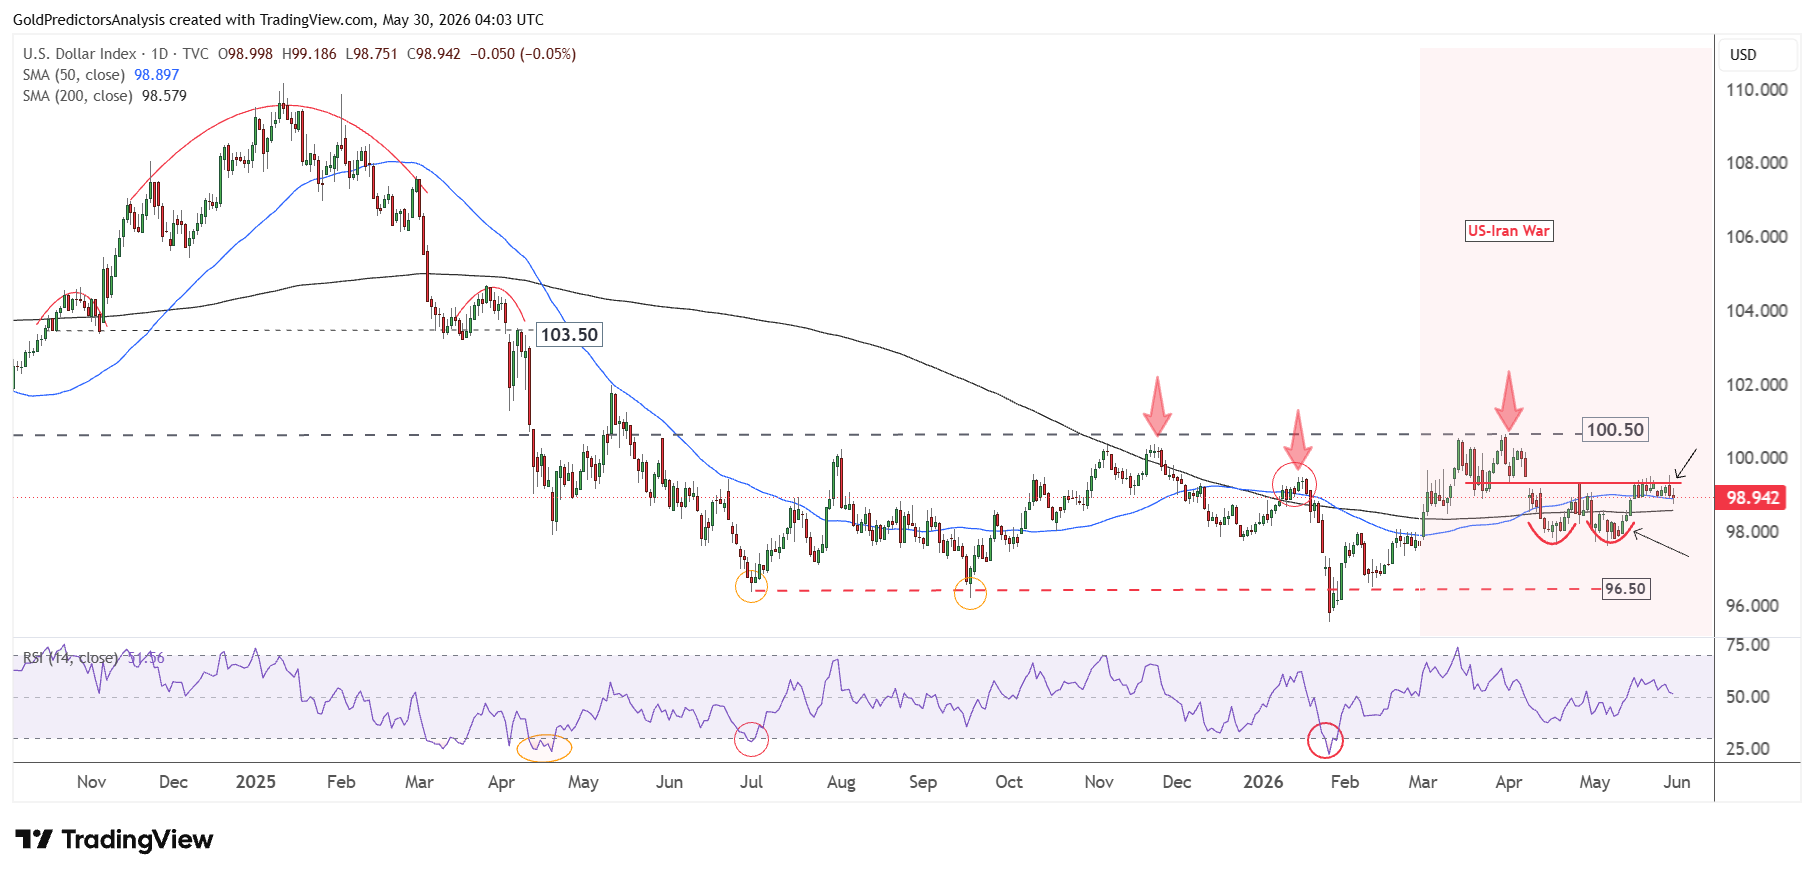
The chart below shows that the US dollar index consolidates at the neckline of the double bottom pattern. A break above 99.40 will push it to 100.50. On the other hand, a break below the 98 level will push the index to 96.
USDJPY Outlook: 160–162 Resistance Remains Key
USDJPY is very sensitive to U.S. yields. U.S. Treasury yields could remain steady if markets remain confident that the Fed will raise rates and keep them elevated for extended periods. This supports the U.S. dollar against the Japanese yen.
The daily chart for USDJPY shows strong consolidation at the long-term resistance of the $160-$162 level. However, the pair has formed a strong bullish structure over the past two years and looks to break above the $160-$162 level.
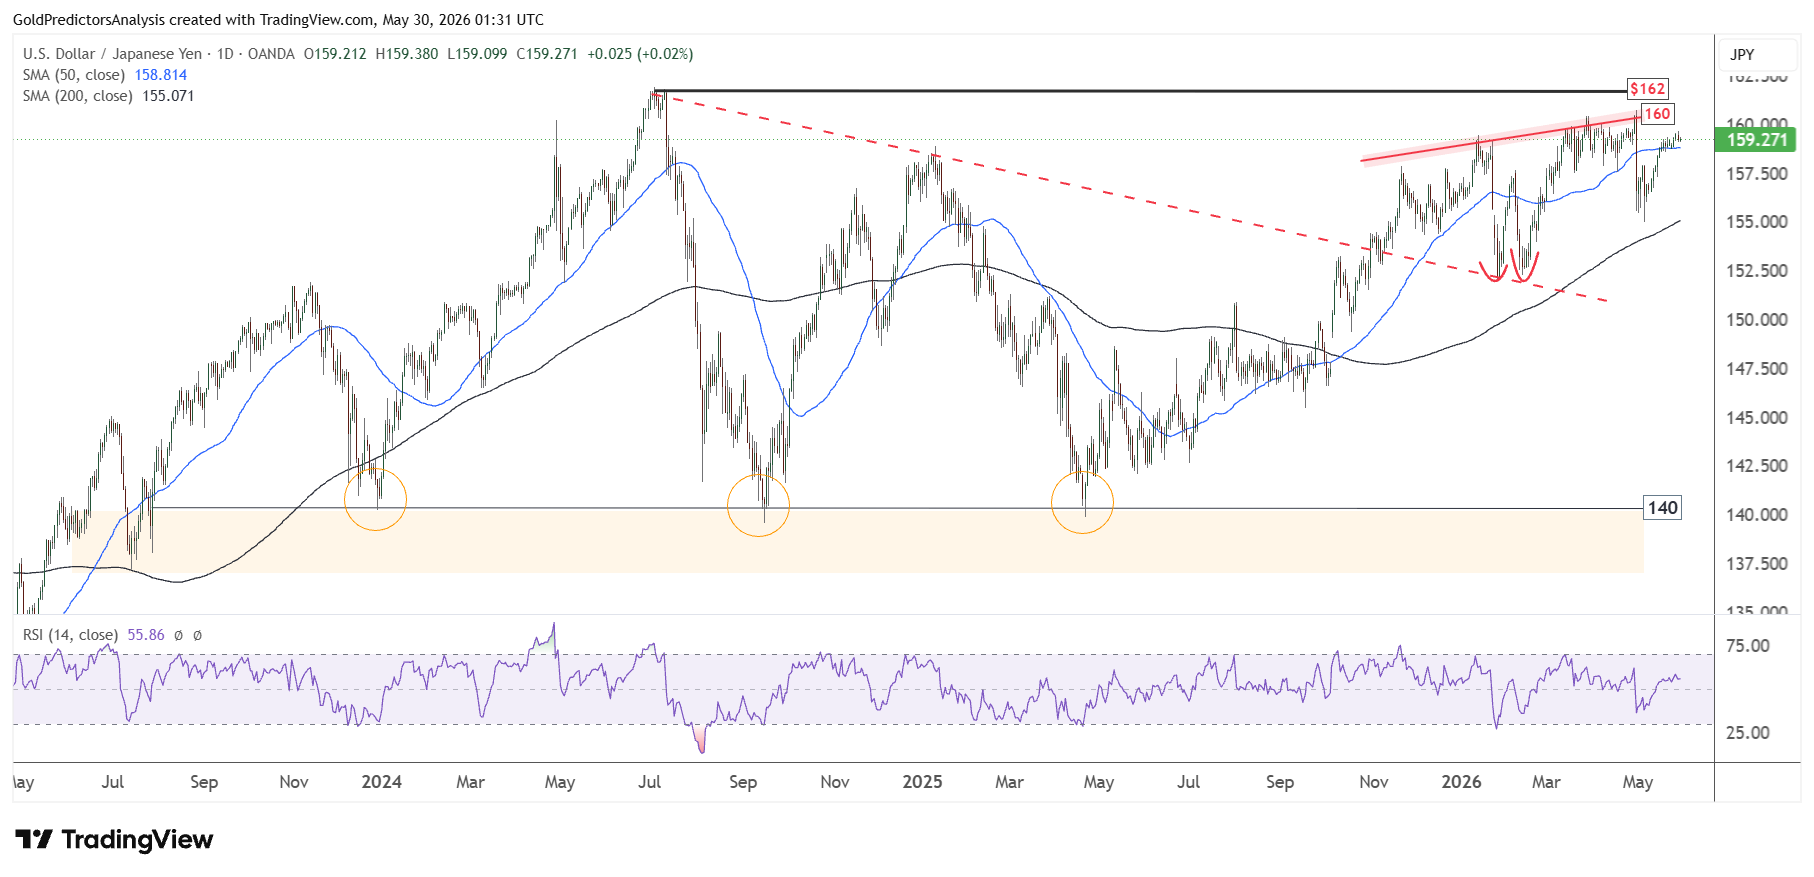
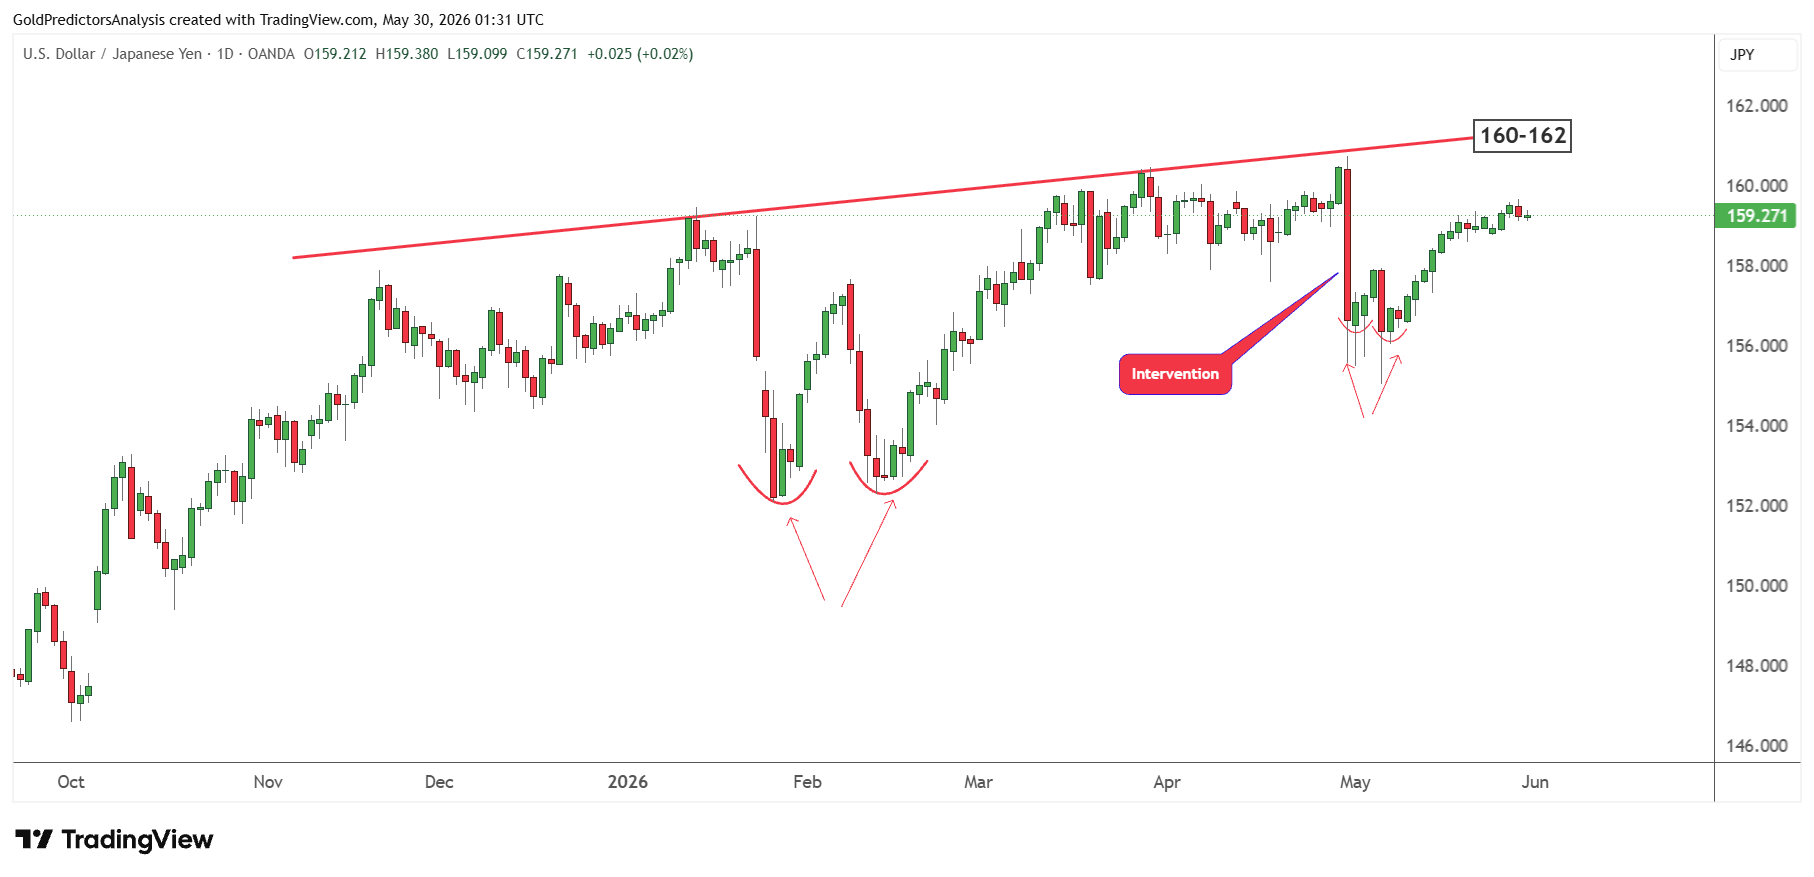
Each time the pair reaches the $160 area, it produces a strong drop. The last drop after the Japanese intervention took the pair toward the 200-day SMA. But now, the pair has already recovered above the 50-day SMA and is poised to move higher.
The importance of the $160-$162 level indicates that it will take some time and some consolidation around this zone to break higher.
This bullish price action is also observed on another chart which shows the formation of double bottom pattern in February 2026 and May 2026. This double bottom indicates that the next move in USDJPY might be higher as long as the pair remains above $150.
EURUSD Outlook: Dollar Weakness Supports Rebound
As the U.S. dollar dropped on growth worries, EURUSD rebounded from the support zone. The tariff refund narrative takes some of the pressure off of U.S. businesses, but it also underscores the impact tariffs had. But if the dollar is viewed as a sign of a policy shift and decreased business confidence, it could lose some support.
But sticky U.S. inflation limits the upside in EURUSD. The Fed is less likely to become dovish due to a 3.8% PCE inflation rate. The dollar could remain supported if 10 year U.S. Treasury yields do not drop below 4.40%. If the U.S. growth outlook deteriorates, this may limit EURUSD uptrend.
EURUSD Technical Analysis: Bull Flag Keeps Upside Bias Alive
From technical perspective, the EURUSD is consolidating within the bull flag pattern on the weekly chart. After forming a low in January 2025 at 1.0176, the strong rally in 2025 and the high in January 2026 at 1.208 have produced a bull flag pattern.
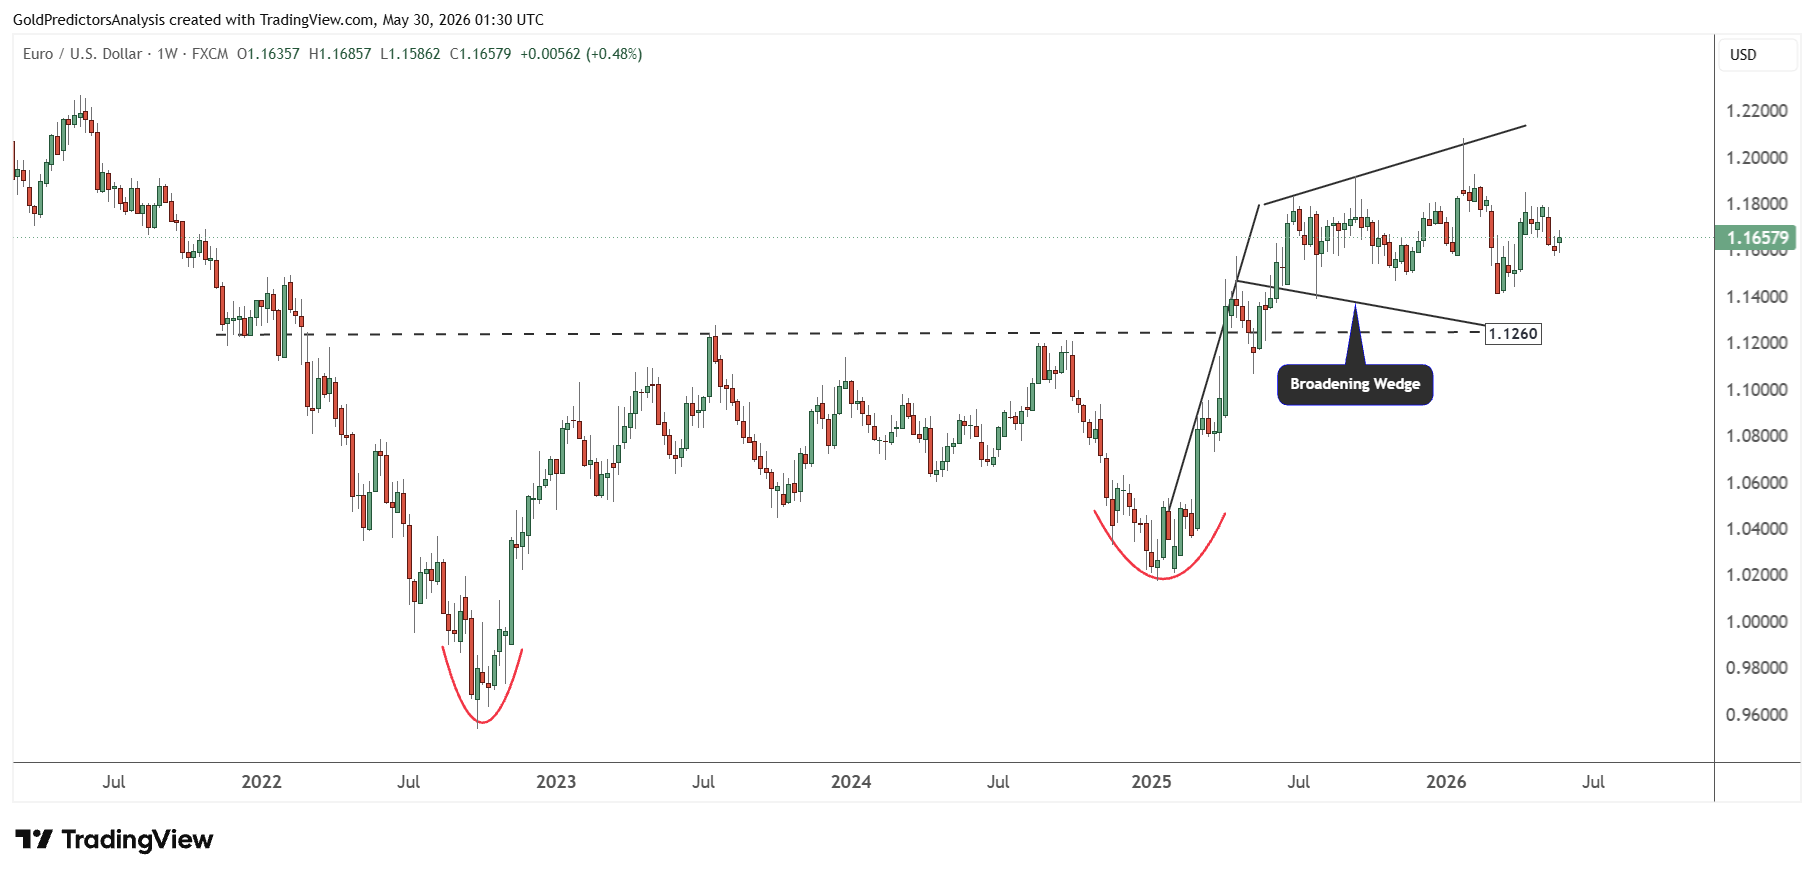
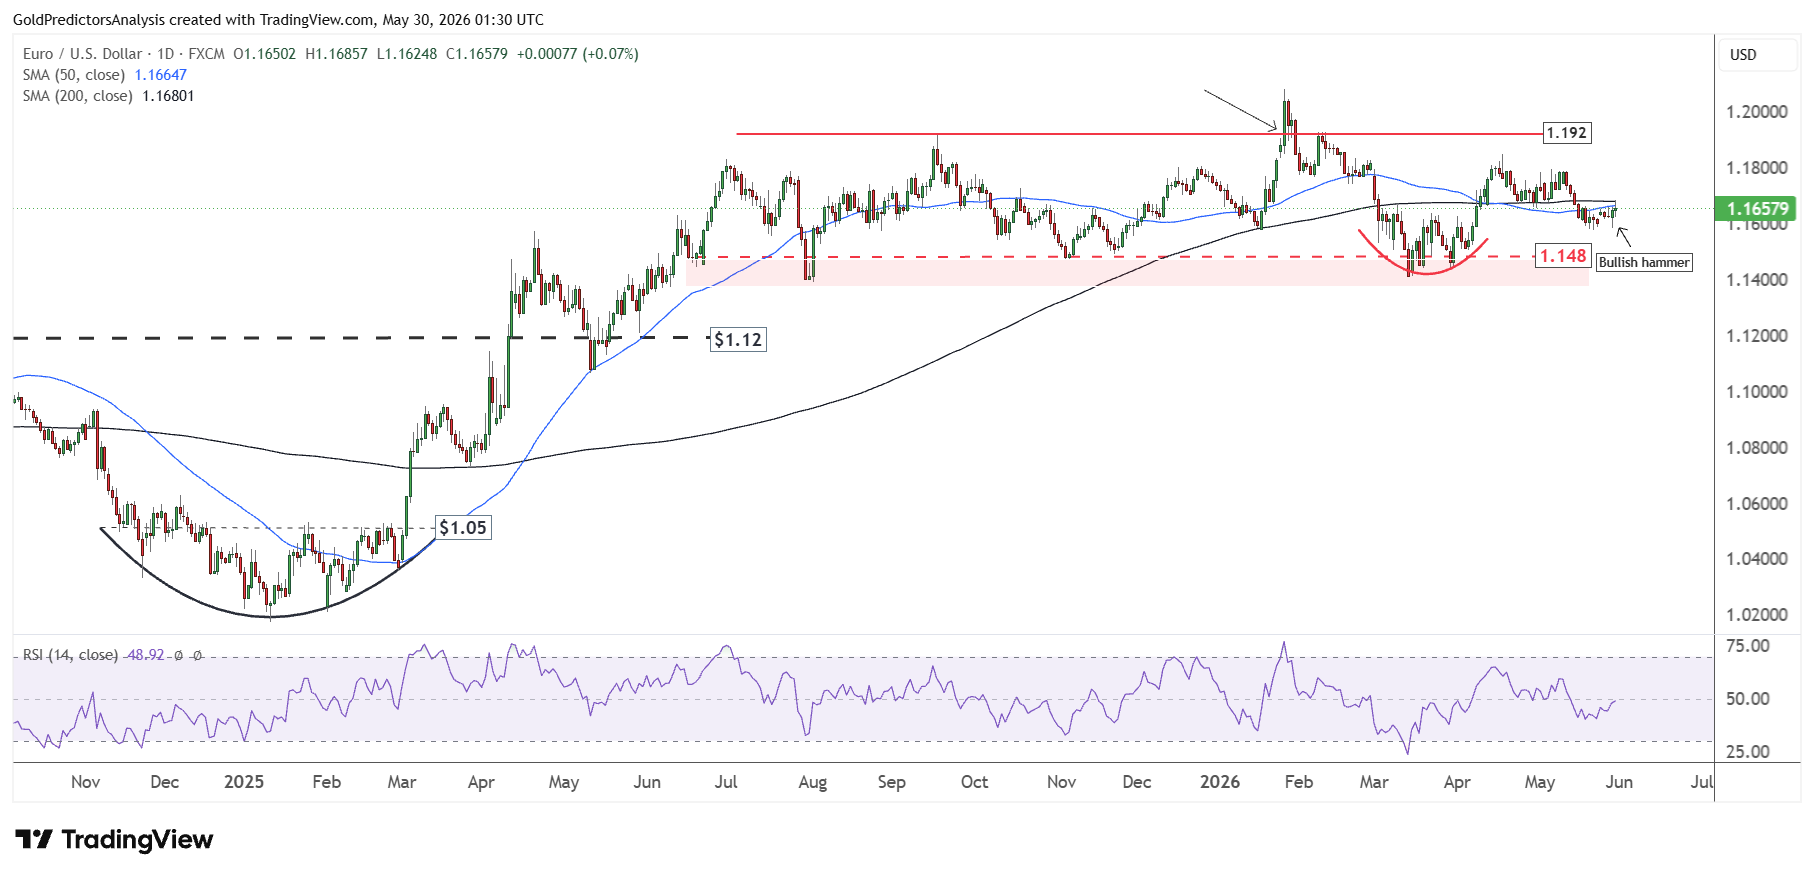
As long as the pair remains above 1.1260, the next move in EURUSD will likely be higher. Despite this bullish pattern on the weekly chart, EURUSD has been consolidating between 1.148 and 1.192 for the past 11 months. However, EURUSD is still above the low formed in January 2025 at 1.0176.
The pair formed a rounding bottom pattern in March 2026 and rallied higher. Now, the pair is forming another bottom by forming a bullish hammer candle after the release of PCE inflation data. However, the daily close was below the 50- and 200-day SMAs, which keeps the short-term consolidation alive in the EURUSD pair.
There is a lot of uncertainty in the currency markets due to uncertainty in the interest rate outlook after the U.S.-Iran war.
Despite this bullish hammer candle, the RSI also remains below the midline, which keeps the pair in negative direction.
Therefore it all depends on US dollar movements. If the U.S. Dollar Index breaks above 100.50, it will likely put pressure on EURUSD. But if the U.S. Dollar Index consolidates between the 96 and 100.50 levels, it will likely keep EURUSD consolidation alive.
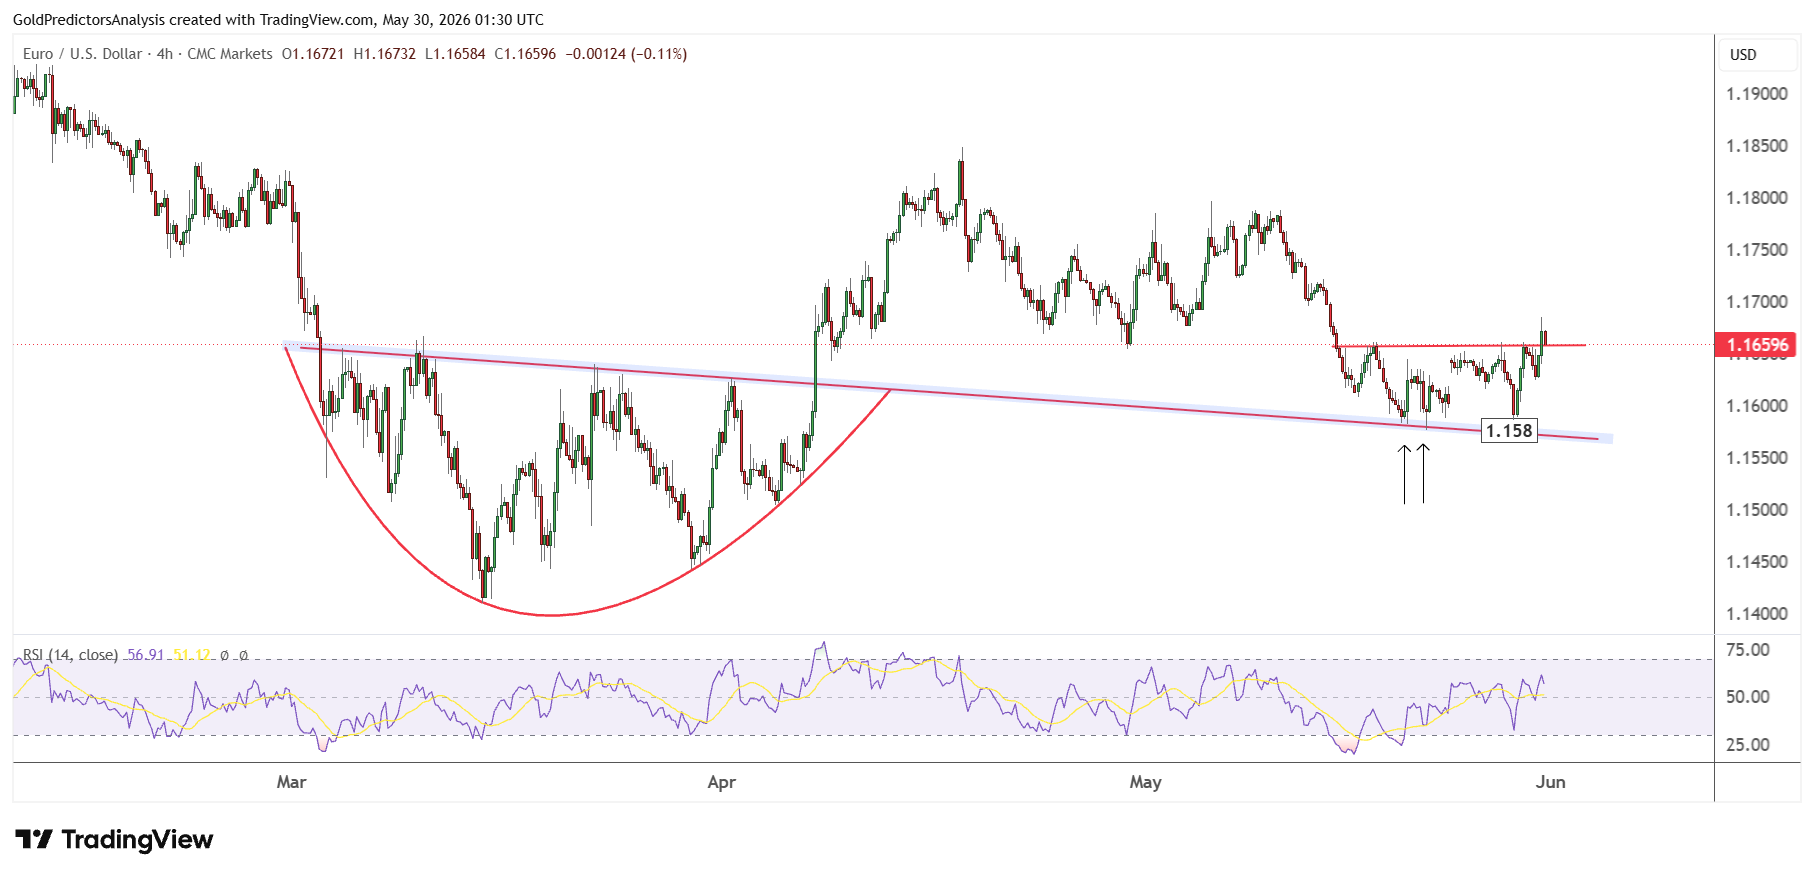
However, the short-term price action in EURUSD is constructive, as seen in the 4-hour chart. EURUSD formed a rounding bottom pattern in March 2026. The breakout from the cup pattern has produced another rounding bottom pattern above the 1.158 level. This rounding bottom is produced after hitting the support of the trend line. This construction indicates bullish price action for EURUSD in the short term.
GBPUSD Outlook: Breakout Needed from 1.30–1.3780 Range
GBPUSD could be more volatile to shifts in risk sentiment. Weaker U.S. growth will weigh on the dollar and help push GBPUSD higher. The drop in US savings rate and non-disposable income indicates that consumers are weakening. This has negative effects on the US dollar if markets expect that demand will be lower. The negative effect on the US dollar will likely push the GBPUSD higher.
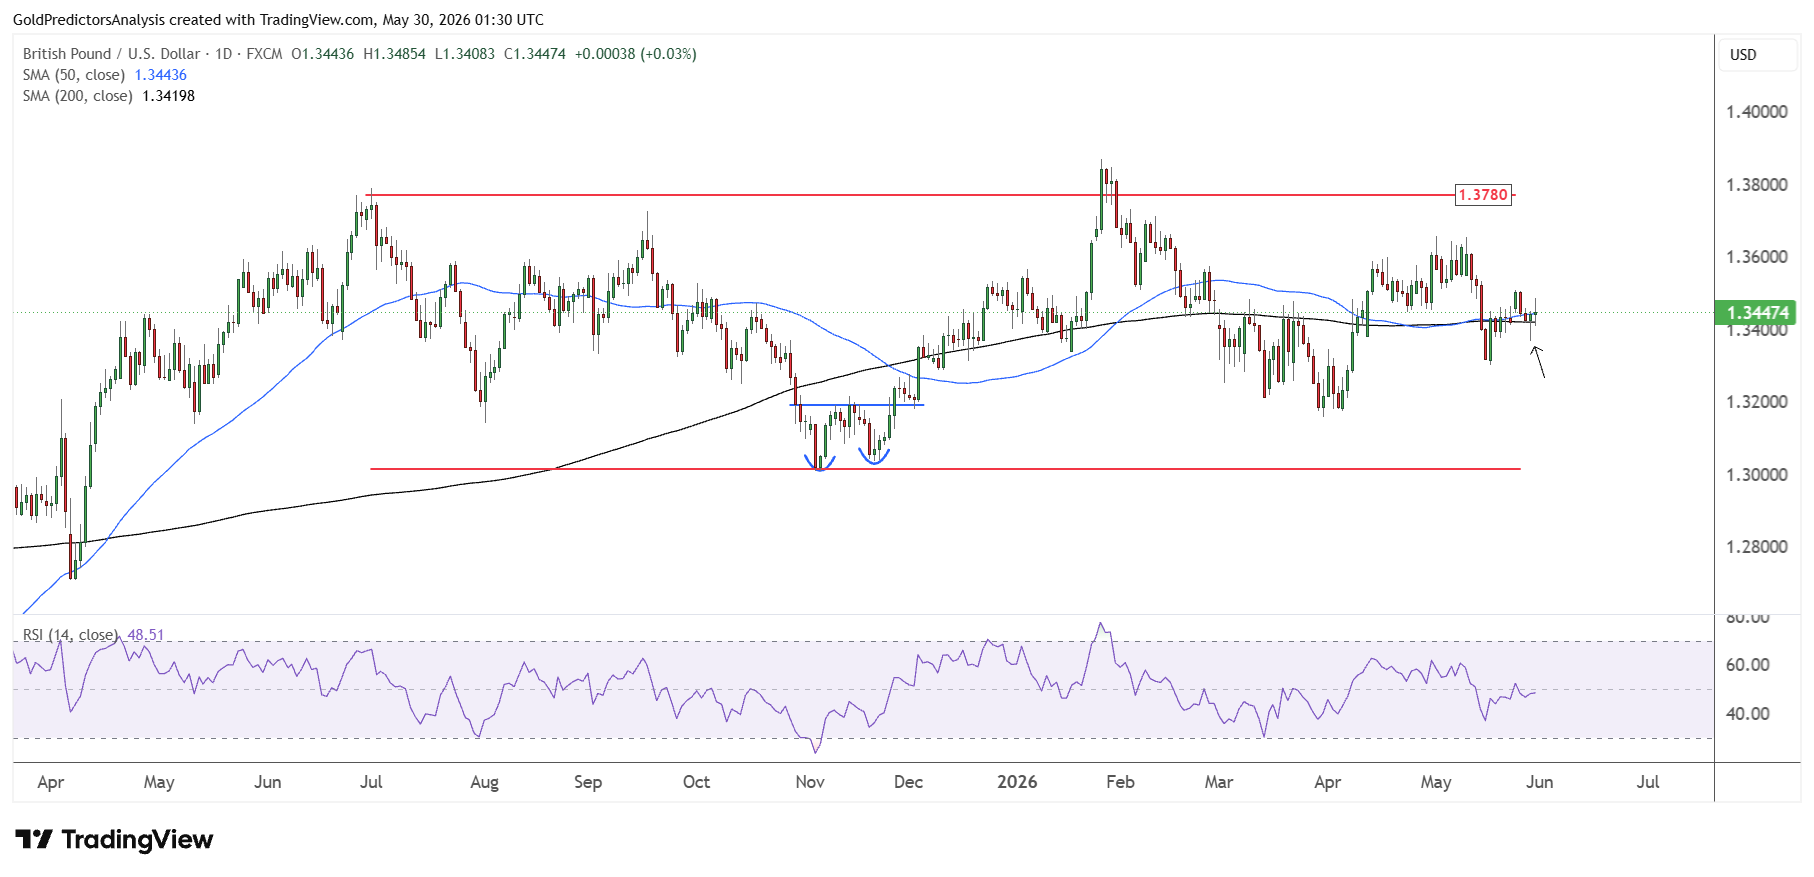
The daily chart for GBPUSD shows strong consolidation between the 1.3780 and 1.30 levels. A break of this range will likely define the next move in GBPUSD. Until this range is broken, the pair will likely trade in consolidation in the short term.
The pair has formed a bullish hammer candle in a similar way to the EURUSD pair after the drop in the U.S. Dollar Index following the U.S. PCE data last week. However, the price action in the short term still remains uncertain, as the pair consolidates within the 50- and 200-day SMAs on the daily chart. A break of this range will likely define the next move in GBPUSD.
Bottom Line
Tariff refunds will relieve some pressure on U.S. companies, but do not remove the underlying economic threats. Growth is moving at a reduced pace, real disposable income is shrinking and consumers are increasingly turning to saving or borrowing to boost spending. Meanwhile, sticky PCE inflation puts the Fed in a difficult position. The Fed would prefer to stimulate growth, but high inflation would not give it much leeway in doing so.
It leaves currency traders with a complicated picture of the U.S. dollar. USDJPY could continue to be supported as long as U.S. yields hold steady, but the pair must break above $160-$162 to open the door for strong rally. On the other hand, the EURUSD and GBPUSD could rally if the dollar weakens on growth concerns, but both are still waiting for better breakouts. The tariff relief will likely have a positive impact on sentiment while inflation, U.S. yields, and consumer data will likely drive the next big move in forex market.