
US Dollar News: Fed and ECB Outlook Shape FX Markets
The U.S. dollar, euro and British pound enter a pivotal week as investors prepare for the Federal Reserve’s July 29 to 30 meeting and the ECB’s decision last week while new data comes through. Most analysts expect that the Fed will leave rates where they are, although the market will be watching out for clues from Chair Jerome Powell given that the latest US data has confirmed the strength of the economy.
June retail sales were up by 0.2% on the month, while the control group increased by 0.4%, and initial claims for unemployment benefits dropped to 208,000, a three-month low, underlining the strength of the consumer and the labour market. This week brings out the second-quarter GDP, the PCE inflation print for June and July non-farm payrolls which could alter thinking around the second half of the year.
The ECB decided to keep its deposit rate at 2.25% as it sees inflation edging toward its 2% target while remaining data-dependent. ECB President Christine Lagarde said growth remains weak, with members continuing to assess the impact of the economic effect of trade and higher energy costs on the economic environment.
Sterling remains supported by expectations that the Bank of England will proceed cautiously after it kept Bank Rate at 3.75%, and it sees the UK policymakers juggle between curbing inflation and a steady wage-growth and a cooling labour market. UK mortgage approvals, consumer credit and business surveys are released this week as they provide evidence for the economy ahead of the next Bank of England meeting.

Dollar Index (DXY) Technical Analysis: Uptrend Holds Above Key Support
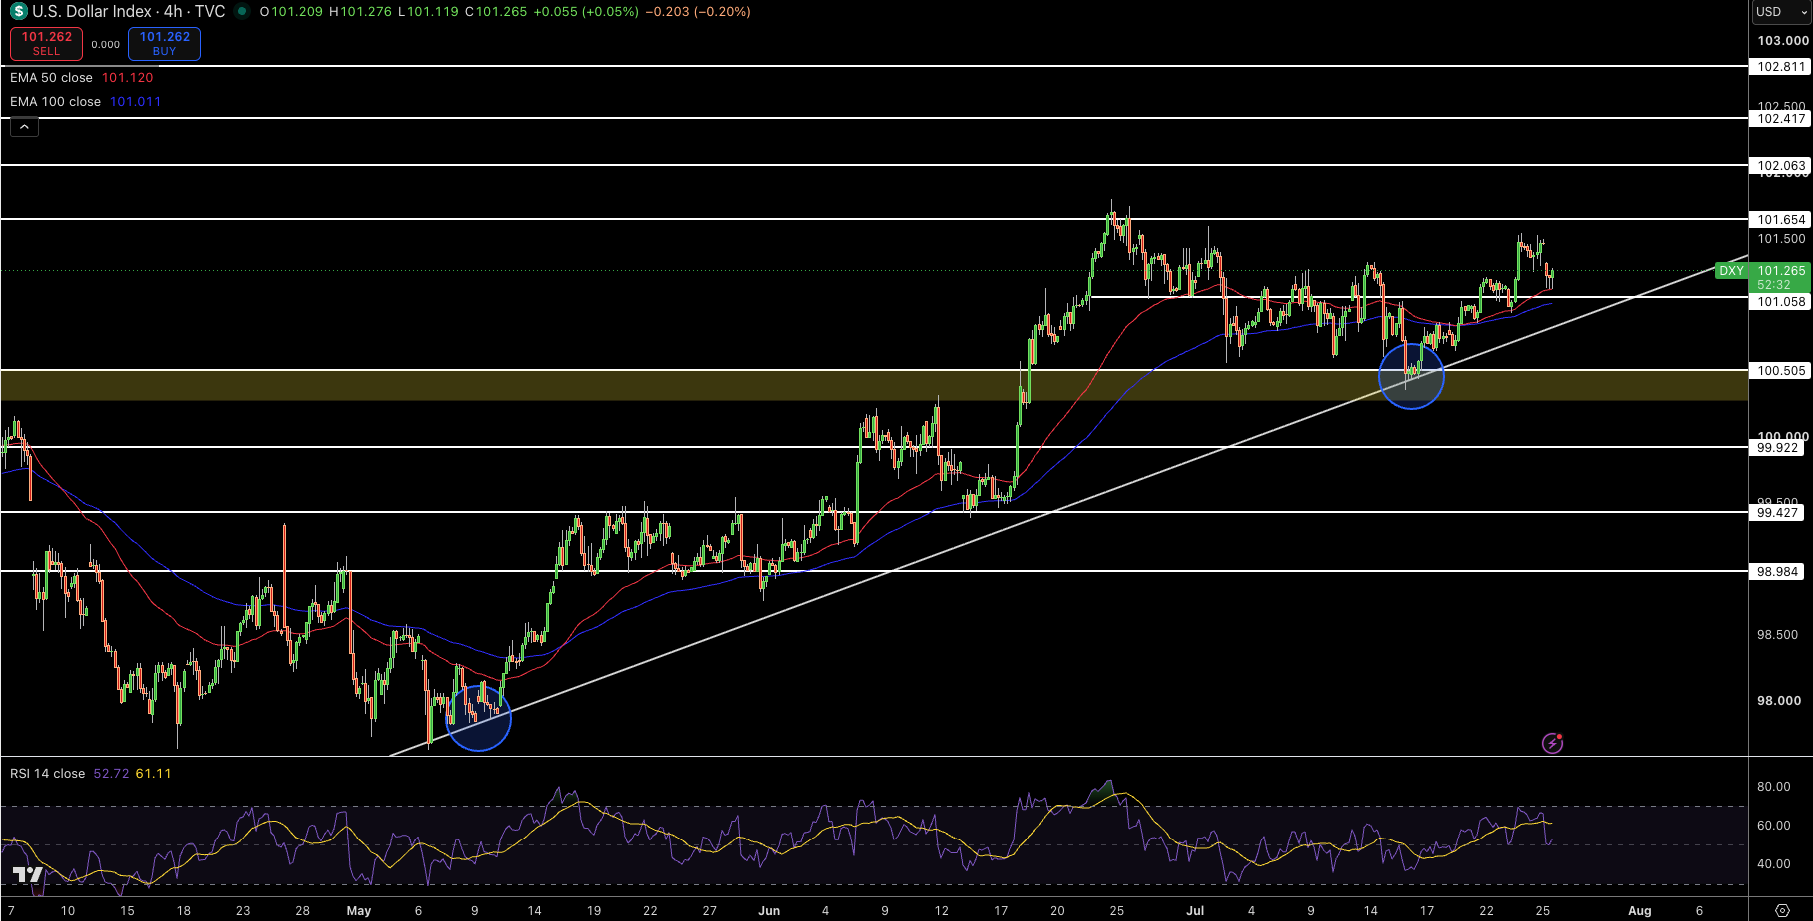
The U.S. Dollar Index is maintaining a healthy uptrend after bouncing off support in the 100.50 zone along the uptrend line. Currently, the index trades at 101.28, keeping the 50-day EMA (101.12) and 100-day EMA (101.01) beneath the index level. The RSI is sitting at 53.
Resistance sits at 101.65, with further levels at 102.06 and 102.42. Support is found initially at 101.06, then at 100.50 and 99.92.
The index is trading above the 101.06 support line; if the index stays above this, bulls are in control. If the index moves above 101.65, it strengthens the bullish view and raises the prospect of a move to 102.06. If the index dips below the 100.50 support, it reduces bullish momentum and opens the prospect of a move to 99.92.
GBP/USD Price Forecast
Every new GBP/USD analysis as it publishes, today's technical signal and key levels, live price — on one page.
See all GBP/USD forecastsGBP/USD Technical Analysis: Recovery Faces Strong Resistance Zone
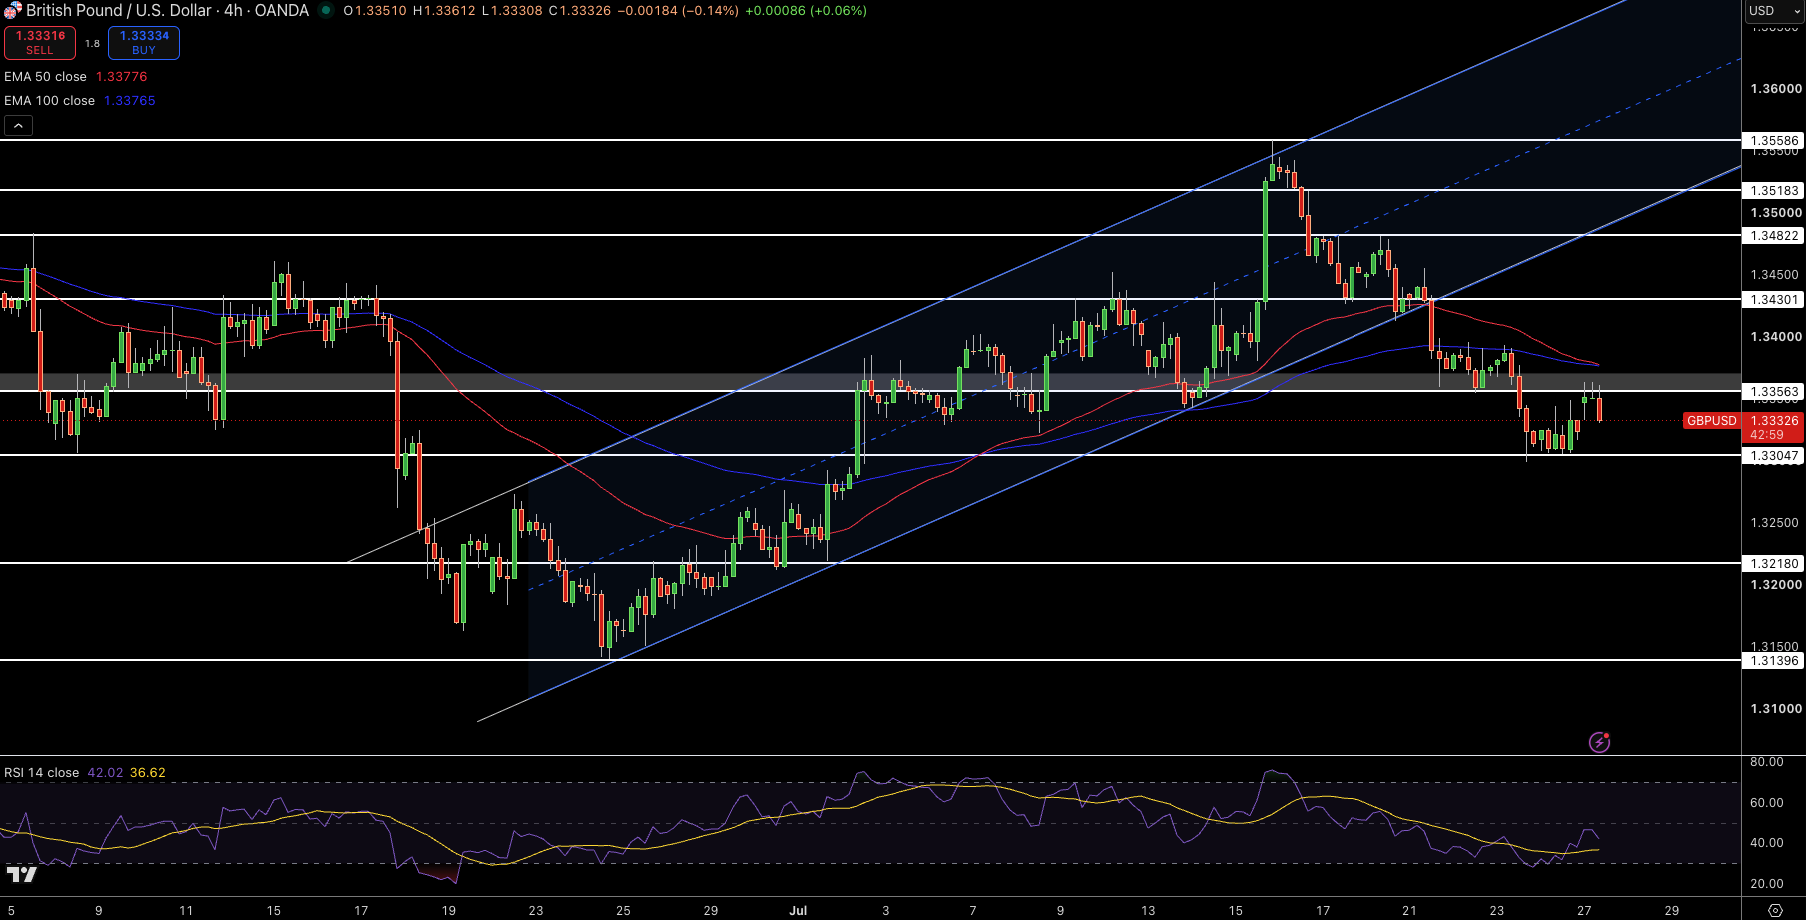
GBP/USD is showing signs of stabilisation after moving down for quite some time. The pair is currently trading at $1.3333. It is attempting to stabilise just below a major resistance area. The 50-day EMA (1.3378) and 100-day EMA (1.3377) are both above it.
Support is initially found at 1.3305, then at 1.3218. Resistance is initially found at 1.3356, then at 1.3400 and 1.3430.
The index has not been able to recover the $1.3356 level; it remains under the overall pressure of sellers. If the index moves down through 1.3305, it could extend the losses towards 1.3218. However, if the pair closes above 1.3356, the downtrend weakens and the prospects for a rise to 1.3400 increase.
EUR/USD Technical Analysis: Bears Defend Key Triangle Resistance
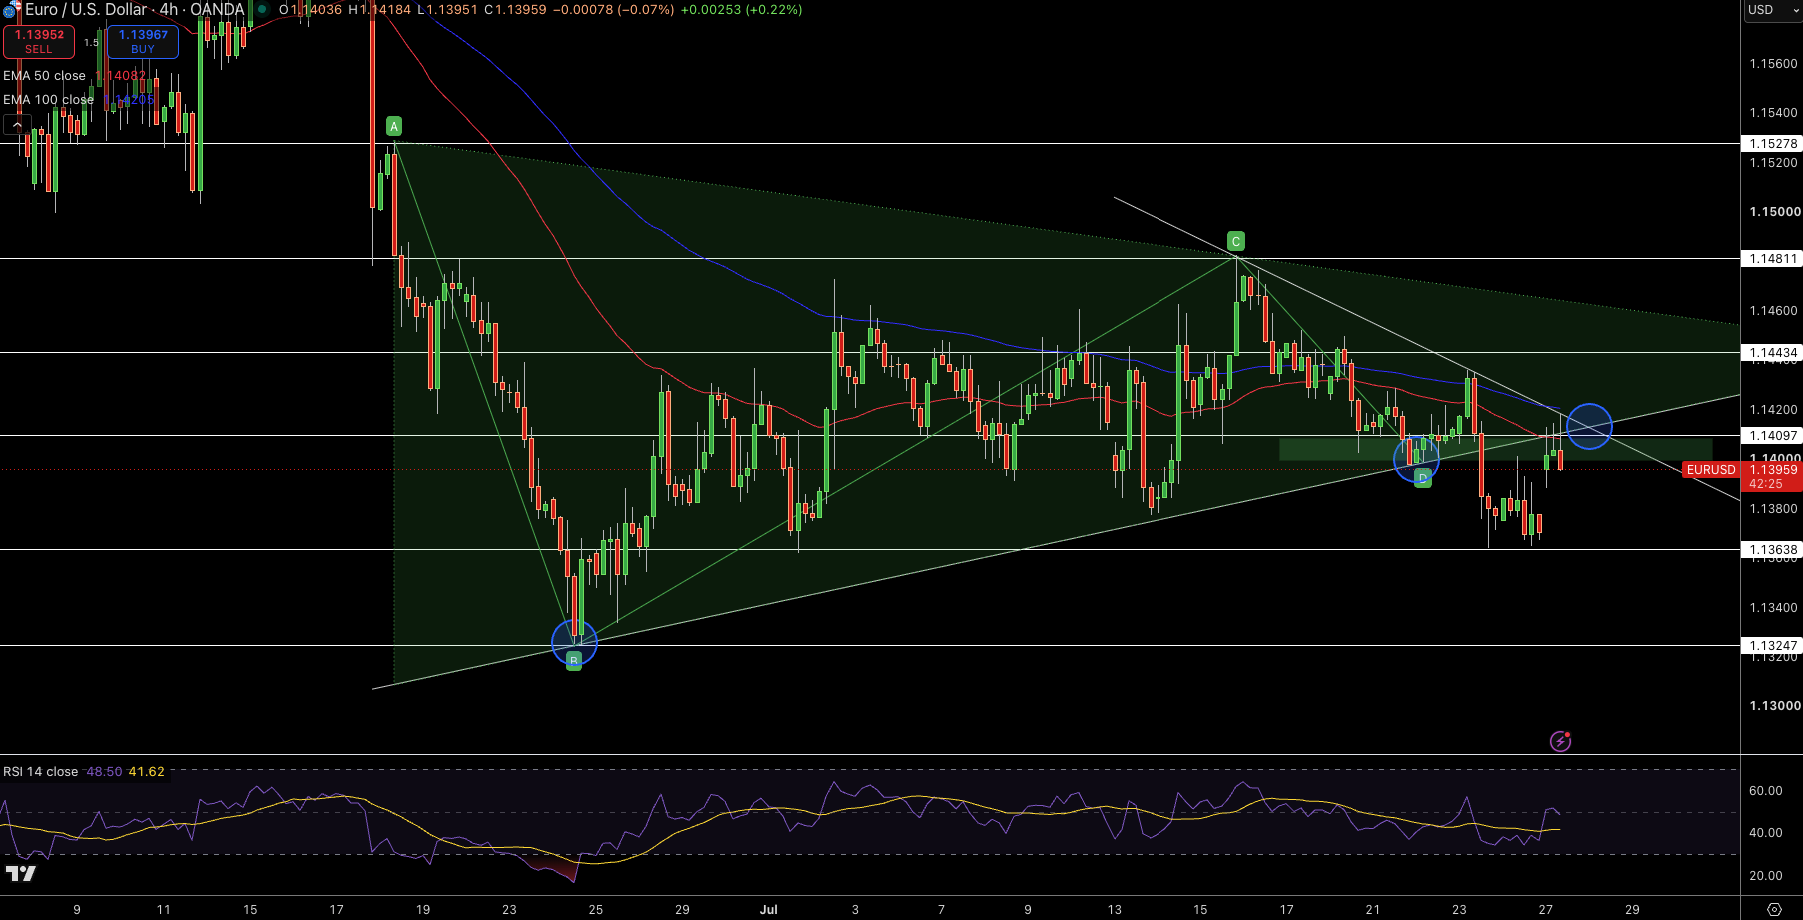
EUR/USD remains bearish after testing the top boundary of the triangle and the two moving average lines without being able to move past them. At present, the index is trading at 1.1395; the 50-day EMA (1.1408) and 100-day EMA (1.1420) are above it and the RSI is at 48.
Support is found initially at 1.1364, then at 1.1325. Resistance is initially found at 1.1410, then at 1.1443 and 1.1481.
The short-term bias remains bearish while EUR/USD trades below 1.1410. A fall below the 1.1364 level opens the prospect of a move to 1.1325. A move above the 1.1410 resistance line improves the outlook and increases the possibility of a move to 1.1443.