



While buyers managed to spark short-term rebounds across several instruments, most of those moves stalled exactly where they were expected to – at major resistance levels. Until those barriers are convincingly broken, the broader technical picture remains unchanged, keeping the focus on whether sellers can regain control over the coming sessions.
Dollar (DX.F)
Let’s start with a quick reminder before today’s update:
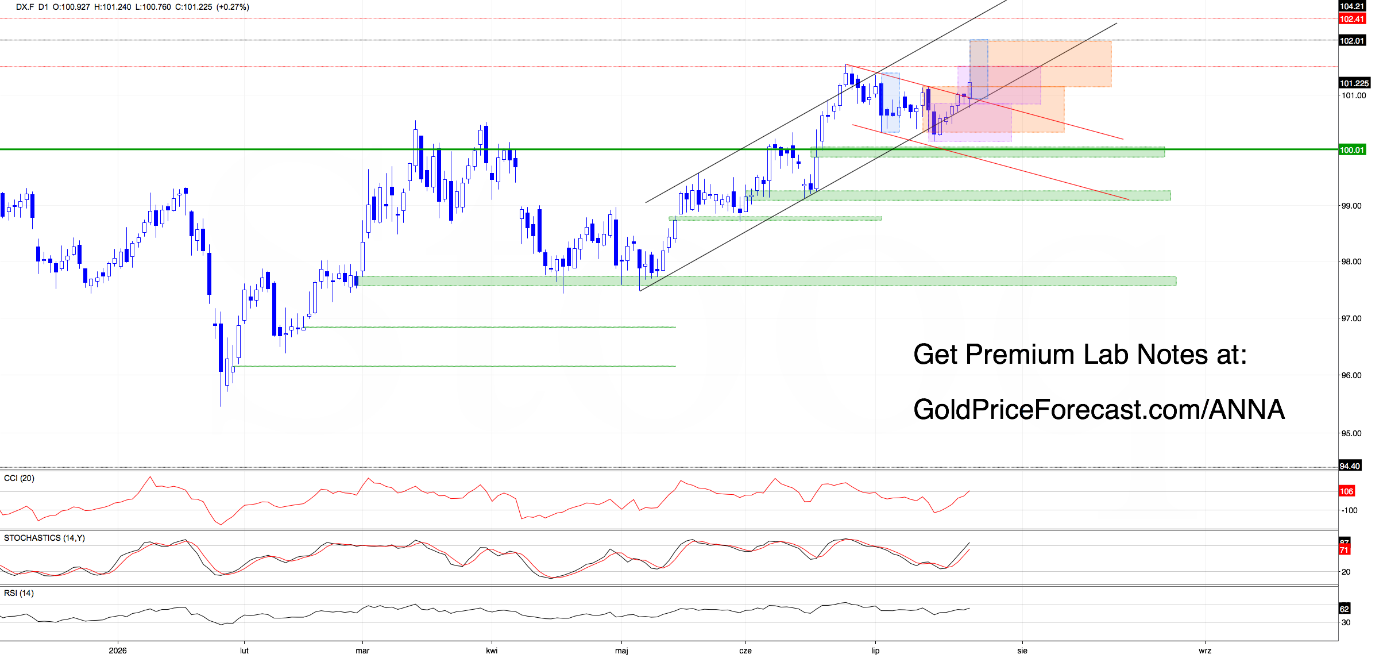
“(…) buyers may now challenge the upper boundary of the red declining channel. A daily close above that resistance would open the door for a move toward the two bearish engulfing patterns and the upper boundary of the orange consolidation (101.21).(…)”
So far, the market continues to unfold exactly in line with our Tuesday scenario. Buyers have successfully broken above the red descending channel, meaning our latest upside target remains fully up to date:
“(…) daily indicators have generated fresh buy signals, giving buyers additional momentum. How high could the dollar climb? Based on the height of the purple consolidation, the next upside target is at least 101.57 over the coming days.(…)”
What happens if the dollar keeps pushing higher?
In that case, the next upside targets come into play around 102.00-102.10 and 102.41-102.50.
Platinum (PL.F)
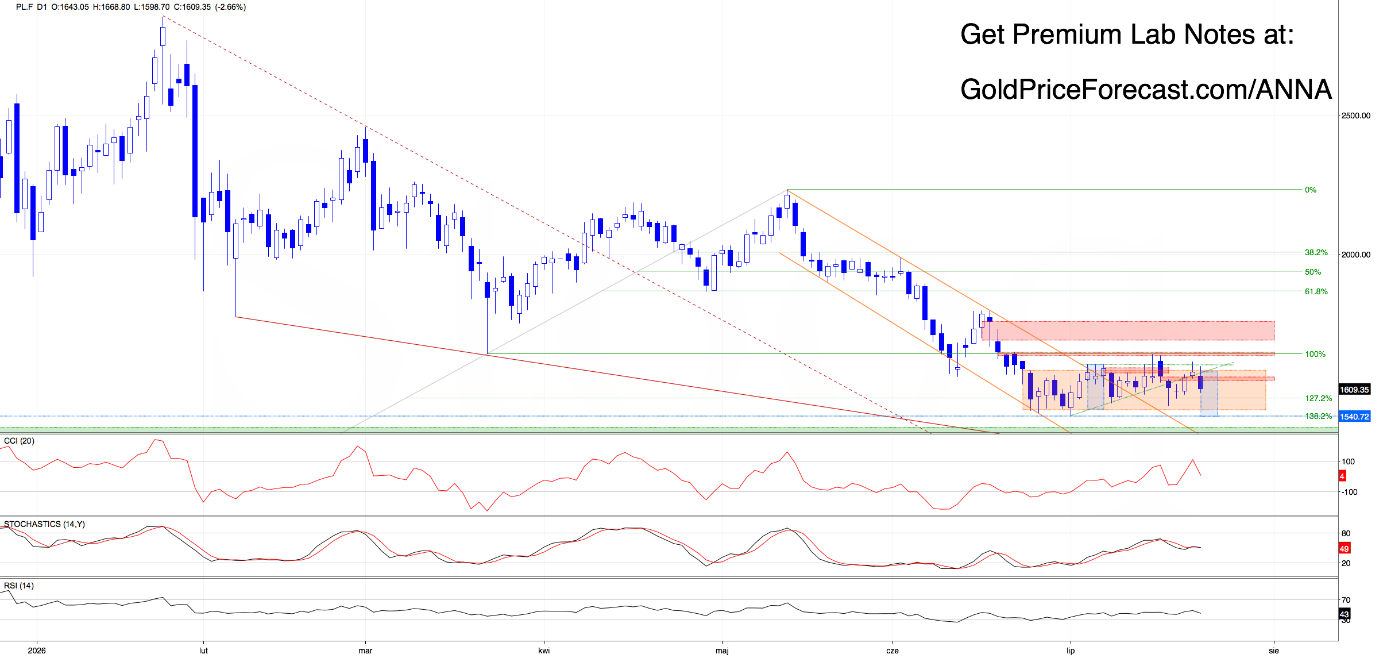
Much like silver, yesterday’s rebound managed to close last week’s bearish gap (1629.50-1642.50), but buyers once again fell short where it mattered most.
The higher gap and the upper boundary of the triangle remained untouched.
That failed breakout attempt led to exactly the same outcome we’ve seen before – a pullback followed by the formation of another bearish gap (1643-1653), making the 1650-1675 resistance zone even stronger.
So, what’s next?
With price once again slipping below the lower boundary of the triangle, sellers now have a solid argument for another test of the lower boundary of the orange consolidation around 1553.
If that support gives way, the door opens toward 1540 (the measured move target) and potentially the recent swing low.
Palladium (PA.F)
Let’s begin with a quick recap before today’s update:
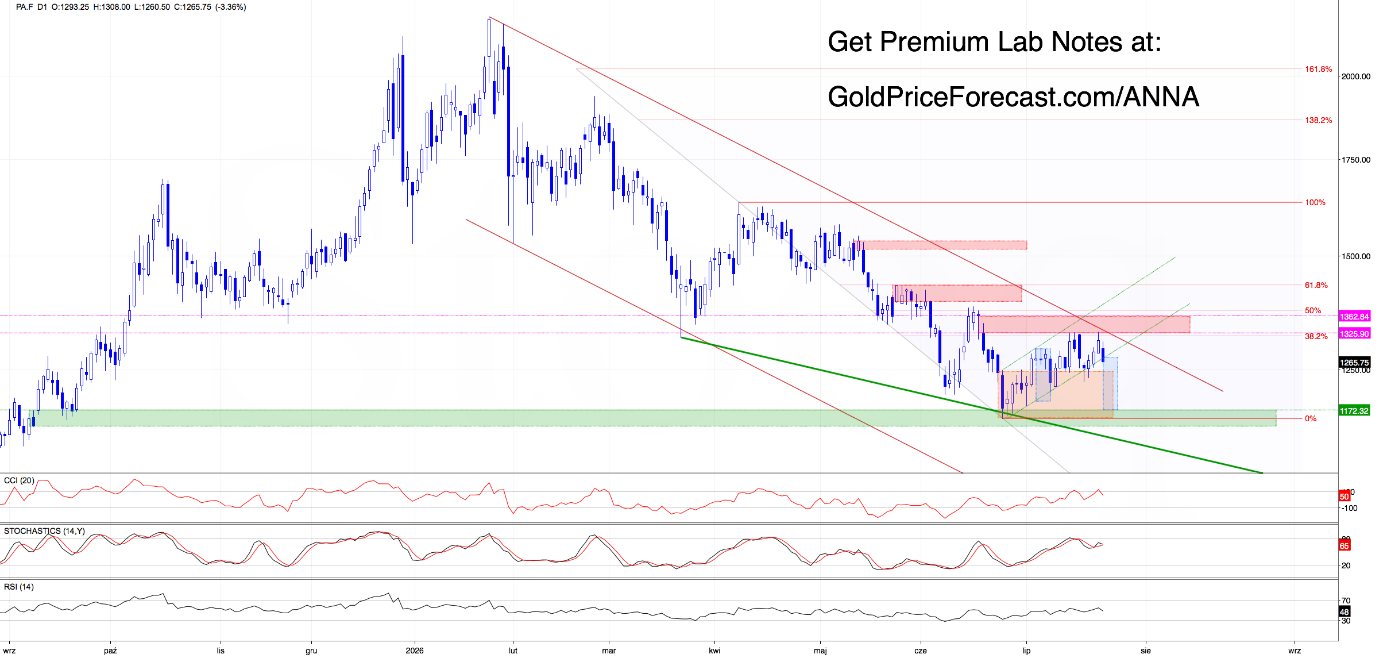
“(…) only a successful close of that gap would open the door for buyers to revisit the recent local highs and challenge the key resistance zone between 1324 and 1363, where the upper boundary of the red declining channel is also located.(…)”
So far, the market continues to develop exactly as expected.
The above-mentioned bearish gap has been filled, and buyers once again challenged the key resistance zone between 1324 and 1363, approaching the upper boundary of the red descending channel.
Once again, however, resistance proved too strong.
Buyers ran out of momentum before breaking higher, leading to another bearish gap (1293-1309) that quickly attracted fresh selling pressure. Over the following hours, palladium dropped back below the lower boundary of the green ascending channel.
What happens next?
If today’s session closes below that support, the 1250 area comes back into play.
More importantly, a daily close below the channel would confirm the broader bearish scenario, opening the door for a move toward 1180 over the coming days.
Today’s Takeaway
Dollar (DX.F)
- Price is testing the upper edge of the red descending channel.
- Above the recent highs, the next areas of interest on the chart sit at 102.00–102.10 and 102.41–102.50.
- The bullish scenario remains valid unless the breakout fails.
Platinum (PL.F)
- 1553 is the level currently defining the range.
- Holding above support keeps consolidation alive.
- Break below 1553 -> opens the door toward 1540 and potentially the recent swing low.
Palladium (PA.F)
- The green ascending channel remains the key level to watch.
- Daily close below the channel -> increases the probability of a move toward 1250.
- Continued bearish momentum could extend the decline toward 1180.
These are chart observations, not recommendations.
Anna