President Trump told the General Assembly this morning that he faces a “big decision” on Iran, and Secretary Rubio said Tehran is near collapse and will seek an end to the war “immediately after the election.” Oil fell again on the words, a fifth straight session, with WTI near $91 after settling Monday at $95.78 and Brent holding near $100.
Gold is down about $21 to trade near $4,363. Oil is down 14 percent in five sessions, yields are 9 basis points off their high, and stocks are 0.7 percent from a record. The metal got $30 of that and is handing it back.

Five Sessions
Yesterday, I wrote that a “big decision” from the president “would be the first real test of whether the oil retreat is a repricing or a pause.” The decision has not been announced, but its framing has: the administration has now said three times in nine days that the end of the war sits on the other side of November 3. Here is what the retreat did to each market.
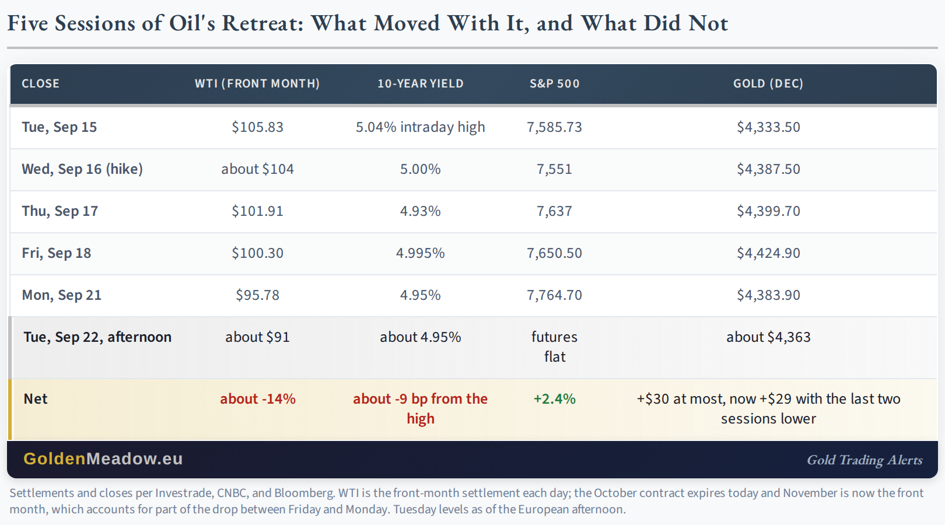
Please read the last column against the others.
Oil’s 14 percent decline pulled the 10-year yield down from its 2007 high and lifted the S&P 500 within reach of its record, which is the rate channel running in reverse. Gold’s share of that was $30 at the top, and the last two sessions have taken $60 off. A metal that gains $30 when its main headwind drops 14 percent, and then gives it back while the dollar holds above 100, is not being priced on oil. It is being priced on the dollar and the two-year, and neither has moved.
Gold Price Forecast
Every new Gold analysis as it publishes, today's technical signal and key levels, live price — on one page.
See all Gold forecastsGold: The Dollar Kept Its Third Close
Yesterday, I wrote: “Today will probably be the third daily close in a row with the USDX above 100, which means that the comeback will be confirmed.” The index held above 100 into Monday’s close and is higher again this afternoon.
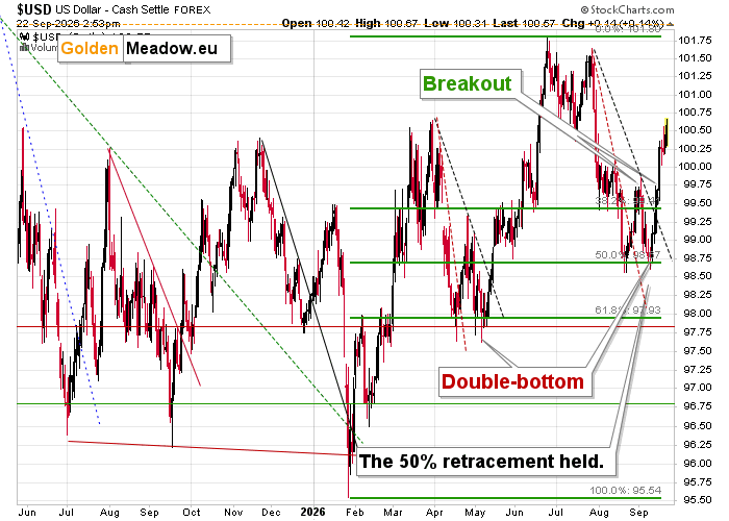
Gold settled Monday at $4,383.90, down $41, and is lower again today. That puts it back in the middle of the range I described yesterday as boring, between $4,300 and $4,440, with the head-and-shoulders and its second right shoulder intact. Silver had its triangle-vertex reversal yesterday and is lower today, which is consistent with that top, and the miners have gone nowhere in a month.
Just as the USD Index is up a bit, gold is down a bit.
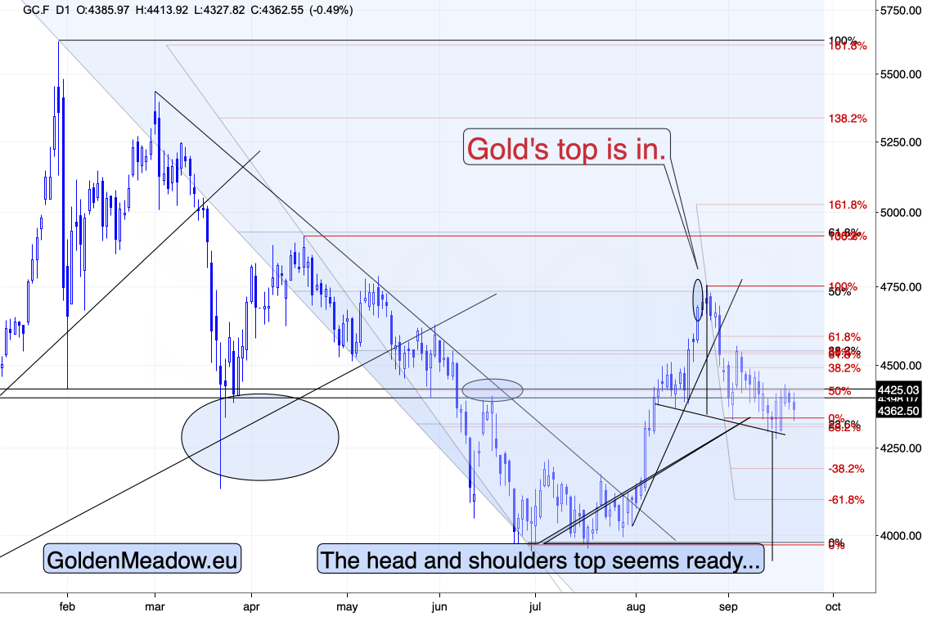
It’s nothing to write home about yet.
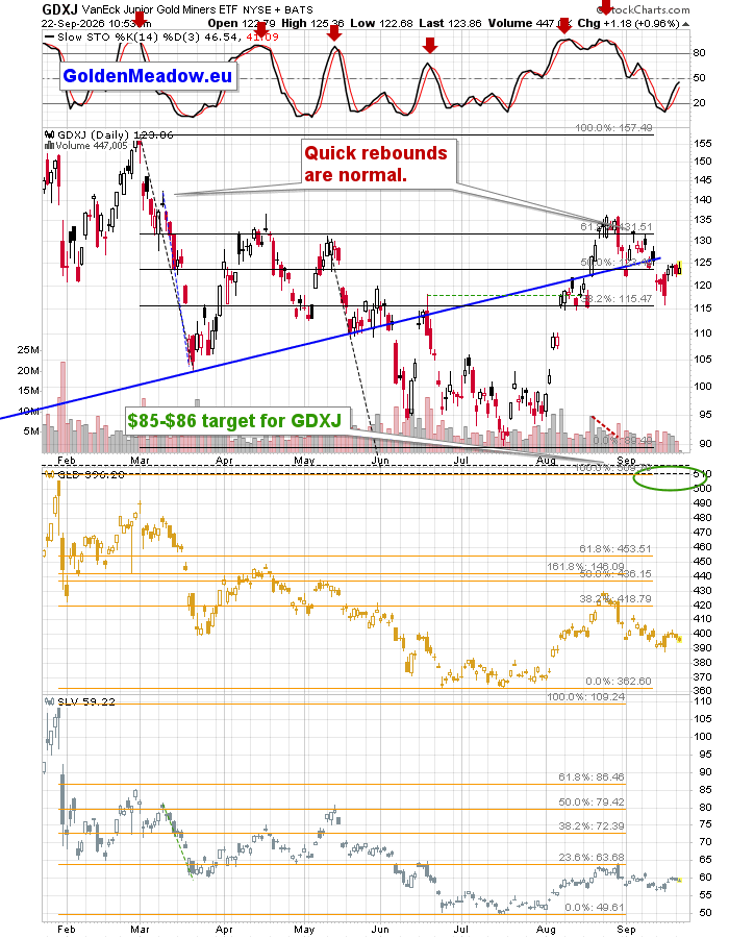
The GDXJ is slightly higher, but overall flat. It seems that lower gold is being countered by tailwind from the rising stock market. Ultimately, however, gold is what miners produce and sell, so the latter will likely move just as the former. And they are both likely to follow the USD Index – in the opposite direction, of course.
And if the current behavior of mining stocks vs. gold makes you think that this is bullish strength, please take a look at the chart below for extra context.
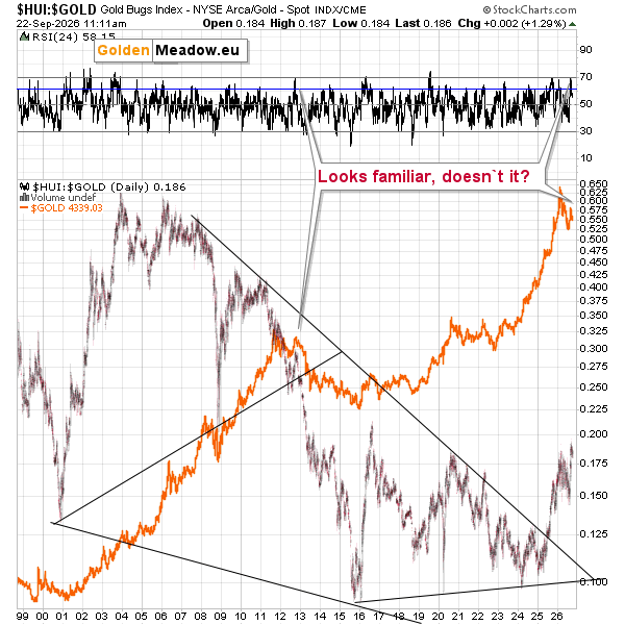
We saw the same kind of “strength” at the 2012 corrective upswing. I’m measuring the character of the “strength” by applying the RSI indicator to the HUI (proxy for gold stocks) to gold ratio. As you can see on the above chart, the final parts of the post-top consolidation – the 2012 top and the recent one – were characterized by a quick spike in the ratio as well as the RSI indicator based on it.
So, no, this kind of “strength” doesn’t tell us that the decline is over. It tells us that history is rhyming, and the next verse doesn’t look pretty.
Where This Leaves Us
My outlook and positions are unchanged, and the profit-take levels remain in place.
Oil is down 14 percent in five sessions on a peace that the administration has now dated to the far side of the election, stocks are a session from a record on the flag scenario I named yesterday, and gold got $30 of the whole move and is giving it back with the dollar above 100 for a third close.
The tape has spent a week removing the reason gold was meant to rise. Gold has spent the same week proving it never had it.
Thank you for reading today’s analysis – I appreciate that you took the time to dig deeper and that you read the entire piece. If you’d like to get more (and extra details not available to 99% investors), I invite you to stay updated with our free analyses – sign up for our free gold newsletter now.
Thank you.
Sincerely,
Przemysław K. Radomski, CFA