The MACD (moving average convergence divergence) is a momentum indicator initially developed by Gerrald Appel. The indicator measures momentum by
The MACD (moving average convergence divergence) is a momentum indicator initially developed by Gerrald Appel. The indicator measures momentum by evaluating the difference between a slow moving average and a fast moving average and comparing that difference, called the spread to a moving average of the spread.
Since the MACD is a momentum indicator many traders use its histogram as a way to determine if prices are poised to break out or break down. A buy signal is created when the spread crosses above the moving average of the spread and a sell signal is created when the spread crosses below the moving average of the spread.
An MACD divergence occurs when the MACD moves in the opposite direction relative to the price of the underlying security. For example, a bullish divergence occurs if a security drops to an all-time low but the MACD prints at a higher low. The fresh all-time low in the price of the security confirms a downtrend, but the higher low in the MACD shows that negative momentum is beginning to weaken. Despite less negative momentum, downside momentum is still outpacing upside momentum as long as the MACD remains in negative territory. Slowing negative momentum which can be viewed as a divergence, many times foreshadows a potential reversal in price action.
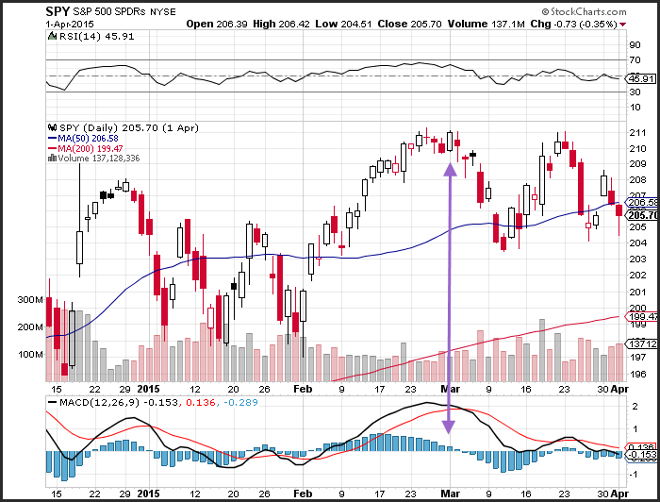
In the chart above of the SPY (S&P 500 SDPR Trust) a divergence can be observed. On 1 March 2015 the SPY hit a fresh all-time high which reflects a bullish up trend in the price of the ETF. The new all-time high on the closing price of the ETF was met with a declining MACD histogram. If you look at the trajectory of the histogram you can see that the level of the MACD is lower than the previous day which is also lower than the day before. In fact, in the days following the divergence of the MACD, a sell signal was created where the spread (the 12-day moving average minus the 26-day moving average) crossed below the 9-day moving average of the spread. In essence, the divergence in the MACD was a precursor to an MACD sell signal.
The MACD indicator intertwines momentum, divergence and a trend following indicator all in one product. There is no limit on the data points that can be used so it may be fair to use the MACD on intra-day data along with daily, weekly or monthly data points. The default setting for MACD is the difference between the 12 and 26-period moving average and comparing that spread to the 9-day moving average of the spread.
The MACD is not an oscillator so it does not forecast overbought and oversold levels like the relative strength index or the stochastics. The MACD does not generate index values so the concept of overbought and oversold do not apply. During sharp moves, the MACD can continue to over-extend beyond its historical extremes. Divergences are the closes thing to overbought and oversold levels and are often precursors to buy and sell signals.
Risk warning: Forward Rate Agreements, Options and CFDs (OTC Trading) are leveraged products that carry a substantial risk of loss up to your invested capital and may not be suitable for everyone. Please ensure that you understand fully the risks involved and do not invest money you cannot afford to lose. Our group of companies through its subsidiaries is licensed by the Cyprus Securities & Exchange Commission (Easy Forex Trading Ltd- CySEC, License Number 079/07), which has been passported in the European Union through the MiFID Directive and in Australia by ASIC (Easy Markets Pty Ltd -AFS license No. 246566).